The Top 25 U.S. Bank Holding Companies With Highest Insurance Income

Insurance income is one of different types of income in the noninterest income portion of a bank’s revenues. For some banks services charges which include overdraft charges can be very high. For others insurance income may be the highest of all noninterest income.

On July 18th, I listed the Top 50 bank holding companies ranked by total insurance income for 2008. Today’ s post shows the Top 25 bank holding companies at which insurance income made up the most of total noninterest income in 2008.

The Top 25 U.S. Bank Holding Companies With Highest Insurance Income


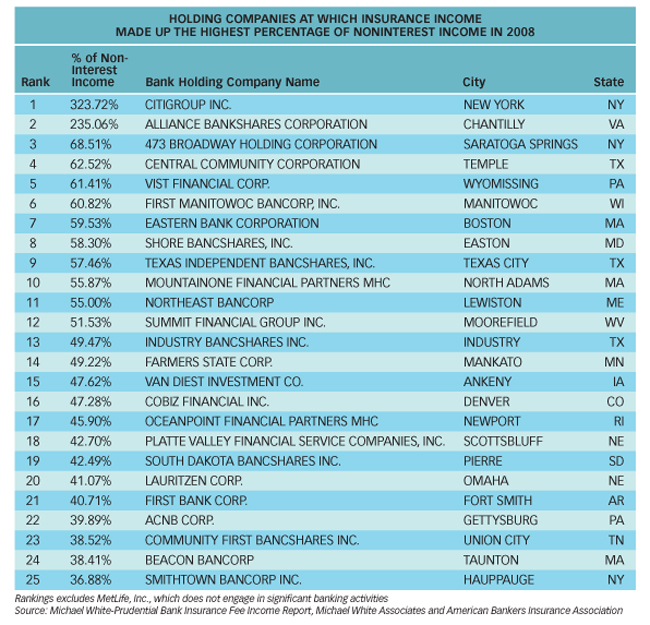
Source: Michael White-Prudential Bank Insurance Fee Income Report, Michael White Associates and American Bankers Insurance Association

As the chart shows above, for some banks insurance income was huge. For eg. – Maine-based small bank Northeast Bancorp (NBN) had 55% of noninterest income come from insurance income. This is a cause for concern since as a bank NBN was dependent too much on insurance income – which is not its core business area.

Five U.S. Banks With High Levels of Service Charge Income

As the Federal Reserve plans to implement new rules to regulate  banks’ service charges, an article titled TCF Risks Backdraft on Overdraft Fees today in the Journal mentioned five banks that have had high levels of service charges as a percentage of noninterest income. In this post, lets take a look some of the fees and charges  that makeup part of the noninterest income.

1.TCF Financial (TCB)

Based in Wayzata,MN, TCF operates in Minnesota, Illinois, Michigan, Colorado, Wisconsin, Indiana and Arizona.The current yield is 1.40%.

In 2Q,2009 fees and services accounted for $77.5 M of the total noninterest income of $156.4M. So service charges exceed 50% of noninterest income. It  represents an increase of 35.9%  from 1Q2009 “primarily due to an increased number of checking accounts and related fee income”. Last year service charges were 54% of noninterest income. Though the number of new checking accounts may have increased, the total service charges are high.

2. Huntington Bancshares(HBAN)

In 2Q,2009 total noninterest income increased $26.8 million, or 11%, from 1Q,2009 to $265.9M. Out of this service charges on deposit accounts was $75.4M. This was a $5.5 million, or 8%, increase from previous quarter reflecting higher personal service charges, primarily NSF charges. Other income include brokerage and insurance income, trust services,electronic banking, etc. Last year service charges accounted for 44% of noninterest income.

3.Fifth Third Bancorp(FITB)

Of the Noninterest income of $2.6 B service charges on deposits amounted to $162M or 11%. Last year for the same period it was just 2%. Electronic payment processing fees also jumped from 4% last year to 9% in 2Q,2009. Retail service charges increased 20% from 1Q,2009.

4.Regions Financial(RF)

The Total Noninterest income was $1.1 B. Service charges, up $19 million or 7 percent, benefited from a higher level of customer transactions, new account growth, and seasonal factors.

5.Associated Banc-Corp (ASBC)

Out of the total noninterest income of $101.9M , service charges on deposit accounts was $29.6M or 29%. Last year service charges were 41% of noninterest income.

As bank profits come under more pressure in the current recession, many banks will raise the fees on various types of accounts or institute new types of fees for services to generate additional revenue. If the Obama administration’s proposal to set up a consumer financial protection agency becomes successful, then high service fees, overdraft fees, etc. imposed by banks on customers may be targeted.

Related Research Paper: FDIC Study of Bank Overdraft Programs

Key Point from the FDIC study: “The banks earned an estimated $1.97 billion in NSF-related fees in 2006, representing 74 percent of the $2.66 billion in service charges on deposit accounts reported by these banks in their Reports of Conditions and Income (Call Reports) .”

The Best Internet Banks in North America 2009

Wells Fargo Bank (WFC) and CIBC (CM) have been named the Best Internet Banks for U.S. and Canada respectively for 2009 by Global Finance magazine.

The winners were selected based on the following criteria:

“strength of strategy for attracting and servicing online customers, success in getting clients to use web offerings, growth of online customers, breadth of product offerings, evidence of tangible benefits gained from Internet initiatives, and web site design and functionality.”

For more details and a listing of winners in various categories go to:

BEST INTERNET BANKS IN NORTH AMERICA 2009

Related Links:

BEST INTERNET BANKS IN ASIA 2009

BEST INTERNET BANKS IN MIDDLE EAST AND AFRICA 2009

BEST INTERNET BANKS IN CENTRAL & EASTERN EUROPE 2009

BEST INTERNET BANKS IN EUROPE 2009

BEST INTERNET BANKS IN LATIN AMERICA 2009

Lost Value of Equities in U.S. State and Local Government Pension Plans = $1 Trillion

In the U.S., the pension plans of state and local governments have a large portion of their assets in equities. Due to this high exposure to equities, the plans suffered severe losses as the markets fell hard until March this year.

The average asset allocation of U.S. Define Benefit (DB) plan has 60% in equities, 30% fixed income and 10% in other assets.

“Public pension plans of U.S. State and local authorities also suffered severe losses due to high equity exposure and substantial leverage. The financial crisis has reduced the value of equities in State and local authorities’ DB plans by about US$1 trillion. These changes will become evident over time because State and local authority plans smooth both gains and losses by averaging the market value of assets over a five year period. However, they will be large as public plans in the United States have on average 60 percent of assets in equities. In addition, they leveraged themselves to fund liabilities. In general, state and local plans had an average funding ratio of 87 percent in 2007 which, by October 2008 would have declined to 65 percent if assets were valued at market values (Munnell et al. (2008)) (the impact of smoothing is shown in Figure 13. In the optimistic scenario that assets level return to the 2007 values, funding ratios are projected to increase to 75 percent in 2013. Under the pessimistic scenario that asset values remain at the level of end 2008, funding ratios are expected to further decrease to 59 percent. In both scenarios, liabilities are assumed to grow at 5.7 percent per year.”

US-Pension-Plans

Source: How the Financial Crisis Affects Pensions and Insurance and Why the Impacts Matter by
Gregorio Impavido and Ian Tower, IMF Working Paper

To download the full paper, click Pension-Plan-Impact-Crisis