VAT Tax Rates in Europe by Country 2022: Chart

Most countries of the world have a Value-Added Tax (VAT) that is levied on goods and services. The VAT is a consumption tax and varies widely among the member nations of the EU and the UK. The highest VAT rates for 2022 are in Hungary which charges 27 percent and Croatia, Denmark and Sweden where it is 25 percent according to an article at Tax Foundation. The lowest rates are in Malta, Cyprus, Germany and Romania. Even in the lowest rate countries the VAT is still high relative to US rates. In Germany for instance the VAT rate is 19 percent. The average VAT rate in the EU is 21 percent.

The following chart shows the VAT rates across the EU and the UK in 2022:

Click to enlarge

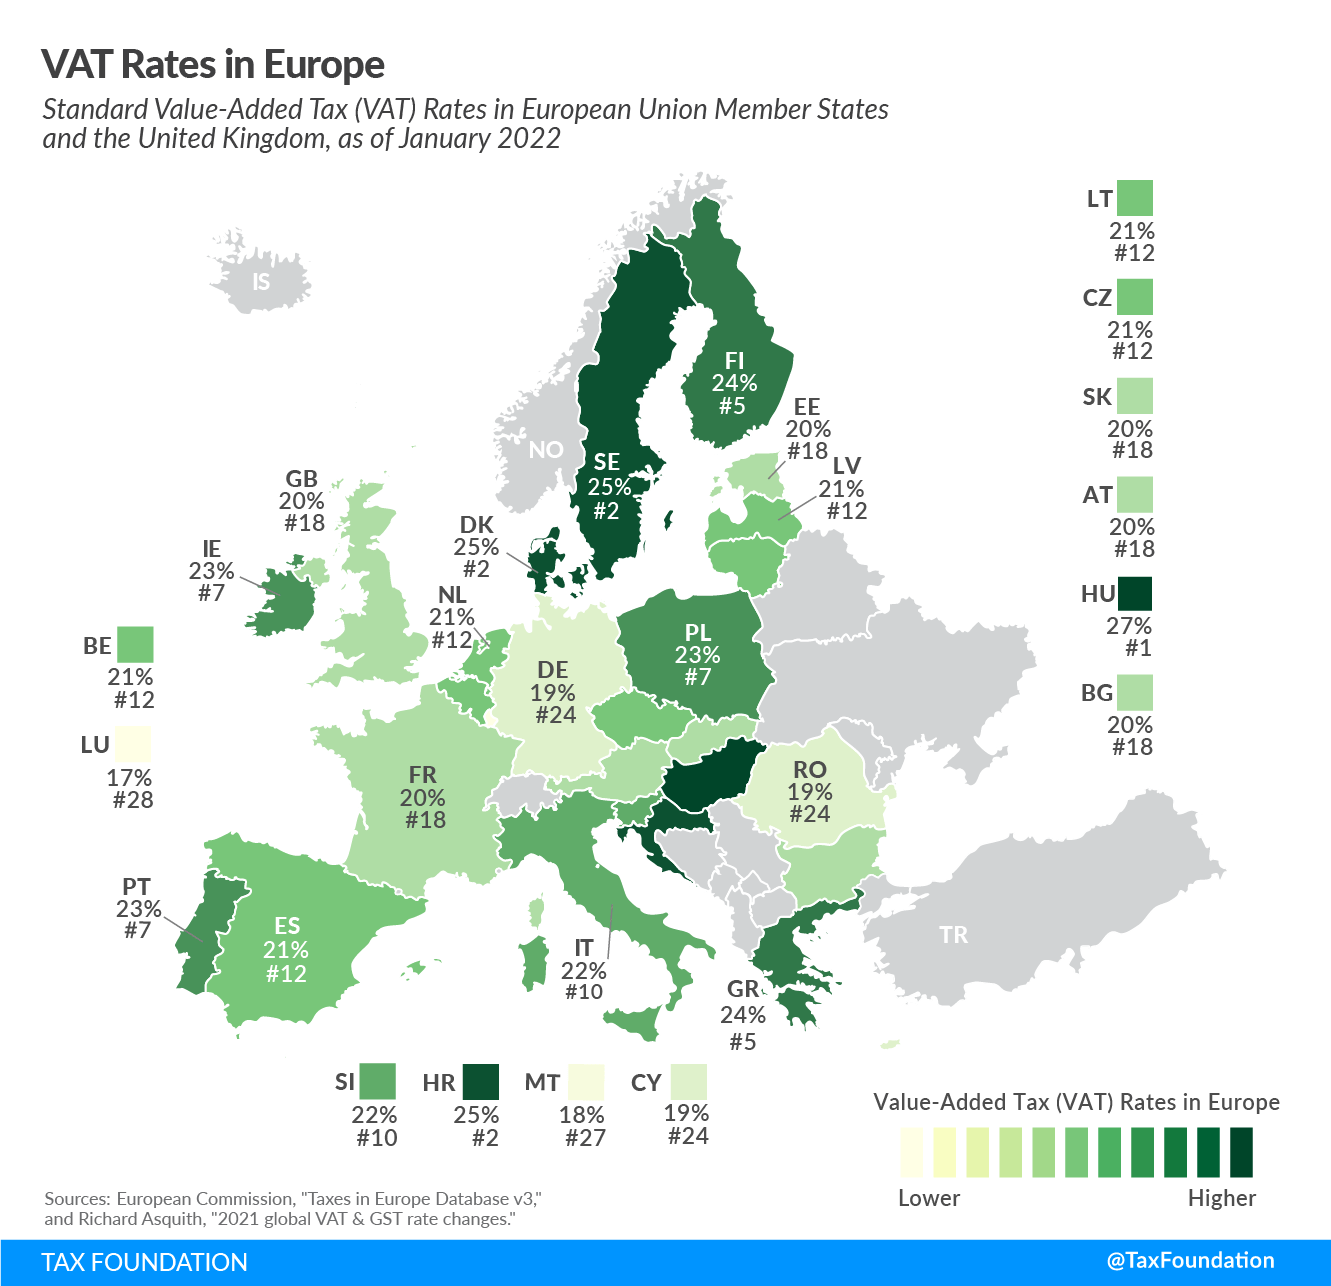
Source: 2022 VAT Rates in Europe by Cristina Enache, Tax Foundation

However there are some exemptions to the standard VAT rates. Below is an excerpt from the piece:

One of the main reasons for reduced VAT rates and VAT-exempted goods/services is the promotion of equity, as lower-income households tend to spend a larger share of income on goods and services such as food and public transport. Other reasons include encouraging the consumption of “merit goods” (e.g., books), promoting local services (e.g., tourism), and correcting externalities (e.g., clean power).

However, evidence shows that reduced VAT rates and VAT exemptions are not necessarily effective in achieving these policy goals and can even be regressive in some instances. Such reduced rates and exemptions can lead to higher administrative and compliance costs and can create economic distortions. A recent study shows that scrapping VAT reduced rates in EU countries will allow standard rates to drop under 15 percent. To address equity concerns, the OECD instead recommends measures that directly aim at increasing poorer households’ real incomes.

In the US, each state levies sales taxes based on its own laws. For example, the current sales tax for New Jersey is 6.625%. Some goods like food are exempted from this tax. That does not mean all foods are sales tax free. A loaf of bread will be tax free but not a soda bottle. The reason being that bread is necessity while soda is a luxury item. It should be noted that in many states local municipalities or counties will tack on an additional tax to the state taxes. So the overall tax rate will be higher.

Generally tax rates are lower in the US compared to the EU. In fact, in states like Oregon, New Hampshire, etc. the sales tax rate is 0%. Another point is the rates in Europe are national rates. In the US, states decide their own rates.

Performance of S&P 500 Index When Interest Rate Rises: Chart

The Fed has planned to raise interest rates this year. The forecast is rates will increase at least three times in the year. In anticipation of rising rates and a multitude of other factors including valuation concerns in certain sectors, US equity markets have turned very volatile this year. With interest rates bound to go higher many investors are wondering how stocks would perform this year. According to an article at Plante Moran, stocks have typically earned positive returns when interest rate rises though there were short-term volatility as shown in the chart below:

Click to enlarge

Source: How do stocks typically perform when the Fed raises interest rates?, Plante Moran

Update: 1/26/22:

Related ETFs:

  • SPDR S&P 500 ETF (SPY)

Disclosure: No positions

U.S. Equity vs. International Equity 5-Year Rolling Returns: Chart

US stocks have performed well during some periods in the past while their overseas peers have outperformed in other periods. For more than 10 years thru September of 2021, US equities have had an excellent run. However this outperformance may not last forever and foreign stocks may take their lead soon. According to an article at Hartford Funds:

 Since 1975, the outperformance cycle for US versus international stocks has lasted an average of 7.8 years. We’re currently 10.5 years into the current cycle of US outperformance, which suggests the tides may be getting ready to turn.

Click to enlarge

The chart shows the values of the S&P 500 Index’s returns minus the MSCI World ex USA Index’s returns. When the line is above 0, domestic stocks outperformed international stocks. When the line is below 0, international stocks outperformed domestic stocks.  

Data Sources: Morningstar and Hartford Funds, 10/21.

Past performance does not guarantee future results. The performance shown above is index performance and is not representative of any Hartford Fund’s performance. Indices are unmanaged and not available for direct investment. 

US equity is represented by the S&P 500 Index; International equity is represented by the MSCI World ex USA Index. Please see below for representative index definitions. For illustrative purposes only.

Source: US and international equities have traded periods of outperformance,  Hartford Funds

Fact of the Day: US Equity Markets Are Down

The US equity market has had a rough start to say the least this year. The S&P 500 is down 7.7% YTD on price return basis and the Dow Jones is off by 5.7%. Tech heavy NASDAQ is performing even worse with the NASDAQ Composite  and the Nasdaq-100 falling 12% and 11.5% respectively.

Below are the returns of select indices:

  • Dow Jones Transportation Average: -7.5%
  • Utility Average: -3.8%
  • KBW Bank: 0.1%
  • PHLX Semiconductor: -13.0%
  • PHLX Oil Service: 14.9%

Consumer staples, energy and financials are performing well. But software, technology, consumer discretionary are in correction territory.

Market breadth is awful.

NYSE:

  • New 52-Week Highs: 8
  • New 52-Week Lows: 526

NASDAQ:

  • New 52-Week Highs: 22
  • New 52-Week Lows: 1323

Source: WSJ Market Data

According to an article in the journal this weekend, 72% of stocks trading on the NASDAQ are in bear markets (or down at least 20%) from their recent highs. More than 40% of the NASDAQ stocks have declined by 40% or more.

Related ETFs:

  • SPDR Dow Jones Industrial Average ETF (DIA)
  • SPDR S&P 500 ETF (SPY)
  • SPDR KBW Bank ETF (KBE)
  • SPDR KBW Regional Banking ETF (KRE)
  • Invesco QQQ Trust Series (QQQ)

Disclosure: No positions