U.S. Health Care: Comparison with Other Countries

How does the U.S. Health Care system compare with other countries?.In order to answer this question I created five charts that are listed below. This article is an update to “A Comparison of U.S. Health Care Spending with Other OECD Countries ” I wrote back in July.

1.Total Expenditure on Health per Capita in USA

Click to ExpandTotal-Expenditures-on-Health-per-capita

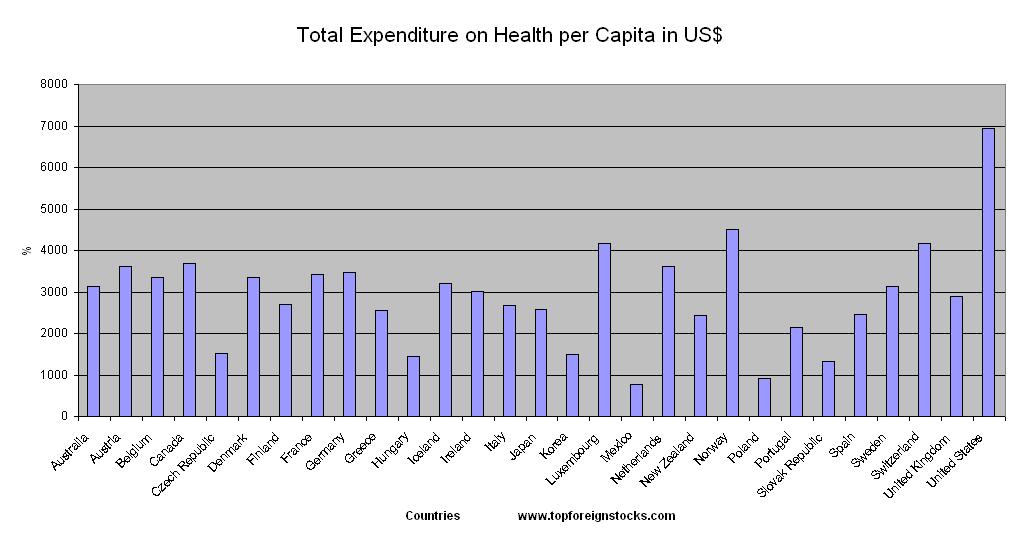
The U.S. spends the highest among the OECD countries  as shown above. The data used is for 2006. On a per capita basis, the U.S. spent $6,933. Most countries in the chart spent less than half of that amount.

2.Total Expenditure on Health as a percentage of GDP

Total-Expenditure-on-Health-as-percentage-of-GDP

Health expenditures as percentage of GDP was 15.8%, the highest among the countries listed. France spent 11% of its GDP while Canada spent 10%.

3.Doctors Consultations per Capita

While the US spends the most amount of money for health care, doctor consultations by Americans is one of the lowest.For France it is over 6 compared to under 4 for US. This chart shows that the higher amount spent by Americans does not necessarily go to seeing doctors. I suspect it goes to many unnecessary things like tons of paperwork, procedures, etc.

Doctors-Consultations-Comparison

 4.Infant Mortality Rates

Infant-Mortality-Rates-Compare-USA

Turkey and Mexico have the highest infant mortality rates. Among the developed countries, the rate for U.S. is high.

5.Total Hospital Beds

Total-Hospital-Beds

Japan has the highest number of hospitals beds per 1,000. The U.S. rate is lower many developed countries like France, Canada and the U.K.

Other charts:

6. Medical Graduates per 100,000

medical-grads

 7. General Practitioners and Specialists

General-Doctors-Specialists

Source: OECD

From the charts above, it is clear that the U.S. health care system needs to be improved. The current system is inefficient and does not offer the best possible for the amount spent.

Ten Leading Global Utility Stocks

The Dow Jones Utilities Titans 30 Index represents 30 leading companies in the global utilities sector. These stocks are selected based on “rankings by float-adjusted market capitalization, revenue and net profit.”

Generally considered as defensive plays, utility stocks offer consistent yields and stable long-term growth. However this year the sector is under-performing other sectors.For example, the S&P 500 is up 10.13% for the year as of September 2nd. The IT components in the index are up a cool 35.88% year-to-date(YTD) But the utility components are the second worst performers with a loss of 1.94% YTD.Mirroring this index is the performance of The Dow Jones Utilities Titans 30 Index which contains utilities from many countries. This index is down 0.05% as of August 31,2009. Last year during the brutal market correction the index fell 32%. The current dividend yield of this is 3.81%.

The Top 10 Components from the  DJ Utilities Titans 30 Index and their current yields are listed below:

Company: E.ON AG (EONGY)
Country: Germany
Dividend Yield: 4.93%%

Company: GDF Suez S.A. (GDFZY)
Country: France
Dividend Yield: 2.01%

Company: RWE AG (RWEOY)
Country: Germany
Dividend Yield: 6.59%

Company: Enel S.p.A.(E)
Country: Italy
Dividend Yield: 14.26%

Company: Tokyo Electric Power Co. Inc. (TKECF)
Country: Japan
Dividend Yield: No regular dividends paid

Company: Exelon Corp.(EXC)
Country: USA
Dividend Yield: 4.32%

Company: Iberdrola S.A.(IBDRY)
Country: Spain
Dividend Yield: 5.76%

Company: Southern Co.(SO)
Country: USA
Dividend Yield: 5.63%

Company: National Grid PLC (NGG)
Country: Uk
Dividend Yield: 7.30%

Company: FPL Group Inc.(FPL)
Country: USA
Dividend Yield: 3.41%

Global Utility ETFs and a Related Article:
SPDR S&P International Utilities Sector ETF (IPU)
S&P Global Utilities Sector Index Fund (JXI)
European Utilities Vs. US Utilities

Knowledge is Power: Dubai,Commercial Property,Debt Trap Edition

Faith in China’s economic growth prospects and fiscal stimulus package keep some fund managers and analysts focused on the long-term.For staunch believers, weakness in China shares is a temporary blip

Berlin calls on banks and industry to work together to thaw the flow of credit to small firms.Credit glacier 

Those in the commercial real estate market are hardly in a festive mood, despite some recent encouraging signs.For Commercial Real Estate, Hard Times Have Just Begun

The risk of unemployment combined with negative equity could catch out young borrowers.When home is a debt trap

Battered but not beaten, Dubai is fighting back with a marketing offensive that includes bringing the X-Factor to town. Dubai has the X-Factor

Alistair Darling has pledged that Labour will spend ‘whatever we can’ to keep people in jobs during the recession…Darling: I’ll spend our way out of recession

“Invest in what you know” can be solid advice, especially when you know your cash is going into institutions carrying a US government guarantee – such as the five that dominated August’s US stock price surge. This isn’t deep science, far from it. Call it “moron capitalism”.Moron capitalism

October has a fearsome reputation built on great crashes and other pyrotechnics, but through the years..Actually, September is the cruellest month

Schönbrunn Najadenbrunn in Vienna.

Are Foreign Beer Company Stocks a Good Buy Now?

On August 27, the Wall Street Journal had an article on the beer industry. The article mentioned that the country’s two largest beer makers Anheuser-Busch InBev NV and MillerCoors are planning price increases this fall due to “favorable pricing environment”. Not many companies plan to raise prices in the current economy. Beer makers apparently think they have the pricing power despite the recession.

Source: The Wall Street Journal

The article added “Overall U.S. beer volumes are declining at the sharpest rate in more than a decade. In the first half of this year, sales from distributors to retailers fell 0.9%, and shipments from brewers to distributors fell 1.3%, according to the Beer Institute, an industry group. Anheuser recently began offering $2 rebates in several states on its economy brands.

Still, beer prices in the U.S. have risen faster than other consumer goods. In July, the price of beer, ale and other malt beverages sold for consumption at home rose 4.6% from a year earlier. Meanwhile, consumer prices in the U.S. overall were down 2.1%, the biggest 12-month decline since 1950, according to Labor Department data.”

In addition domestic brands, Americans also consume many foreign brands such as Heineken, Fosters, etc. In this post lets review four foreign beer company ADRs.

1.Melbourne, Australia-based Foster’s Group (OTC: FBWRY) is engaged in the manufacture and sale of beer, spirits, ciders and wine products. For the fiscal year 2009 that ended in June, Fosters announced that its profit quadrupled due to increase in beer sales. However wine business was did not perform so well. Beer sales in Australia and Asia remained strong. For 2009, “net profit rose 292.3% from the prior year to 438.3 million Australian dollars ($367 million), while net sales revenue rose 2.7% to 4.49 billion Australian dollars.” Currently FBWRY has a 5.52% yield and the stock is up 14% YTD.

2.Heineken NV(OTC: HINKY) is a Dutch maker of many popular beer brands including the flagship Heineken.The company has over 200 brands in its portfolio and sells them in over 70 countries. The dividend yield is 1.70% and YTD the stock has grown by 36.16%.

3.In 2007, SAB Miller(OTC:SBMRY) of UK and Coors merged their US operations and formed MillerCoors to compete against Anheuser-Busch. Some of the famous brands of SAB Miller are Miller Genuine Draft and Miller Lite. YTD SAB Miller ADR has increased by about 37.50%.

4.China’s second largest brewer by volume, Tsingtao Brewery(OTC: TSGTY) is mainly a beer maker but with operations in other areas related to car rental, logistics , domestic travel services, etc. Profit in the first half of this year was up 67%. Sales rose by 12.6% in the same period. As of Friday’s close, the OTC traded stock has risen by nearly 67% YTD.

Knowledge is Power: Global Energy Outlook 2009 Edition

Toyota, now the leading auto manufacturer worldwide, is shutting an assembly operation in California…California loss is Ontario’s gain: Toyota

Germany’s Federal Bank President Axel Weber, in an interview with a German newspaper, said that while the German economy may have bottomed out, it remains too early to declare an end to the financial crisis.German federal bank president: crisis not over yet

GM signs up to a joint venture with the Chinese state-owned carmaker FAW to make light trucks and vans. General Motors expands in China

Frankfurt banks on good times’ return
Try telling Juergen Ferdinand the recession in his native Germany is over.

BEIJING, Aug. 29 (Xinhua) — Industrial enterprises in 22 Chinese provinces, regions and municipalities generated 1.11 trillion yuan (163 billion U.S. dollars) of profit in the first seven months, down 17.3 percent from the same period last year, according to the latest official figures. China’s industrial profit down 17.3% in first seven months

The International Energy Outlook 2009 (IEO2009) presents an assessment by the Energy Information Administration (EIA) of the outlook for international energy markets through 2030. U.S. projections appearing in IEO2009 are consistent with those published in EIA’s Annual Energy Outlook 2009 (AEO2009), (March 2009). International Energy Outlook 2009 

Russians owe more than 150 billion rubles to banks MOSCOW, August 28 (Itar-Tass) — Russian citizens owe more than 150 billion rubles to banks, a source at the Federal Bailiff Service told Itar-Tass on Friday.

Jobless rate at 5.7% and consumer price fall of 2.2% highlight fears of double dip.Japan unemployment hits record high

Camel

Sharjah

Sharjah, UAE