Stock markets worldwide have rallied strongly since the lows reached in March this year. In the U.S. the S&P 500 is up about 22% year-to-date. Despite many not trusting this rally, the market continues to defy gravity. As the market continues to go up or hold ground at current levels, some are convinced that the equity market is a leading indicator.
Retails investors who disappeared from the markets from the brutal market crash of the credit crisis are slowly trickling back into the markets. Investors are putting money back work via 401K retirement plans, their individual investment accounts, etc. As a result, asset management firms are seeing rise in the flow of assets.
Asset management companies make significant amount of profits from management fees. The average mutual fund fees in the US was over 1.5%.
“In 1940 there were only 68 funds and about 300,000 shareholder accounts. By 1990 there were 3,000 funds and 62 million accounts with a trillion dollars in assets. In 2008, 8,000 funds had 265 million shareholder accounts and almost $10 trillion in assets, down from $12 trillion in 2007. According to the Investment Company Institute, the trade association for the mutual fund industry, 45 percent of all American households owned mutual funds in 2008, up from 41 percent in 1998.”
As assets under management rise, fund companies stand to benefit.Despite the explosive growth the ETF industry, mutual funds still manage the largest amount of funds invested by retail investors.
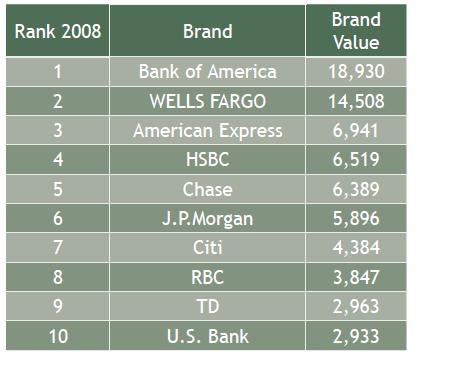
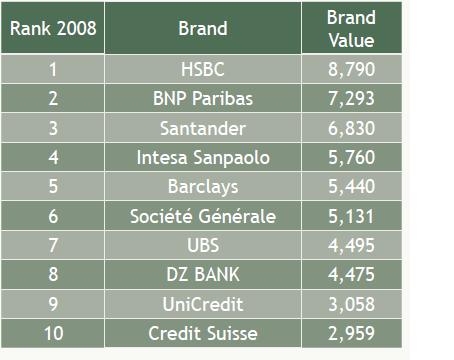
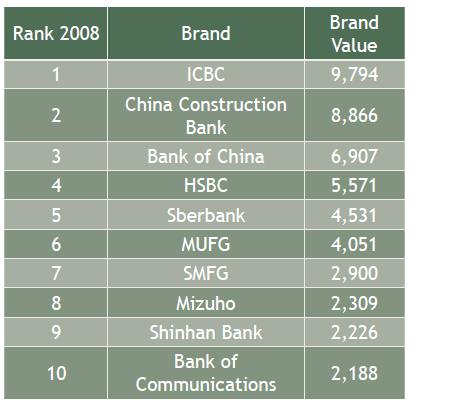
One way to identify investment opportunities to analyze the top mutual fund companies that manage the most assets. The following table shows the Top 10 Mutual Fund Companies by Assets:

Some of the asset managers listed above are not publicly listed. The top mutual fund companies that are listed int he markets include: JP Morgan & Chase Co (JPM), BlackRock Funds (BLK), Federated Investors (FII), Bank of New York Mellon/Dreyfus Co(BK) and Goldman Sachs & Co (GS). Other large US asset management companies include Alliance Bernstein(AB), Eaton Vance(EV), Franklin Resources inc(BEN), Legg Mason(LM) and T. Rowe Price Group Inc(TROW).