Which Emerging Markets Are Cheap Now: Chart

Many emerging markets have held up well so far this year relative to their developed world peers. These markets are performing well for many reasons including rising commodity prices. Countries such as Brazil, Chile in Latin America, South Africa in EMEA and Malaysia in the Asian region are in the positive year-to-date.

With that said, some investors may be wondering which markets are cheap now. A recent article at Schroders noted that countries such as Chile, Colombia, South Africa, Poland, etc. are cheaper based on 12-month forward P/E.

The expensive and cheap emerging markets:

Click to enlarge

Source: Is Mexico’s resurgence losing steam?, Schroders

Related ETFs:

  • iShares MSCI Mexico Capped Investable Market (EWW)
  • Global X FTSE Colombia 20 ETF (GXG)
  • iShares MSCI Brazil Index (EWZ)
  • WisdomTree India Earnings (EPI)
  • The iShares MSCI India ETF  (INDA)

Disclosure: No positions
Three Charts on U.S. Gun Culture

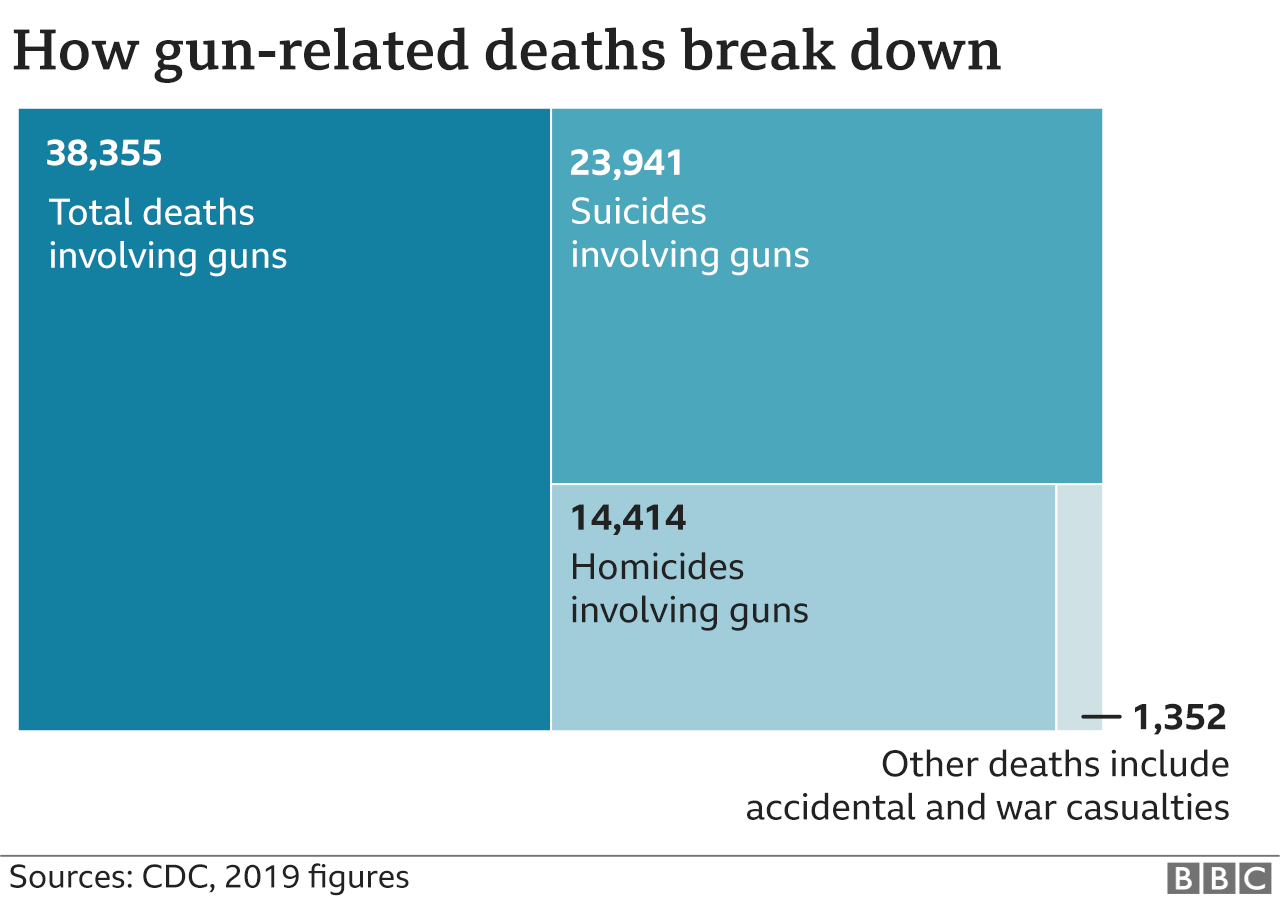
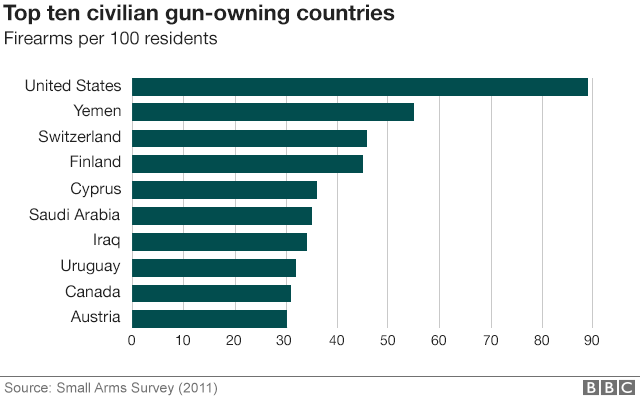
The BBC published an article last on the gun culture in the U.S. The article listed many shocking facts. The following are three charts from that piece.

The U.S. is the top civilian gun-owning country in the world with a ratio of 120.5 firearms per 100 residents. The second top country in the ranking is Yemen, where a civil war is currently in progress. Among the developed countries, Switzerland has the next most gun ownership.

Click to enlarge

Unlike Switzerland, a total of 45,222 people died from gun-related injuries in the US in the year 2020.


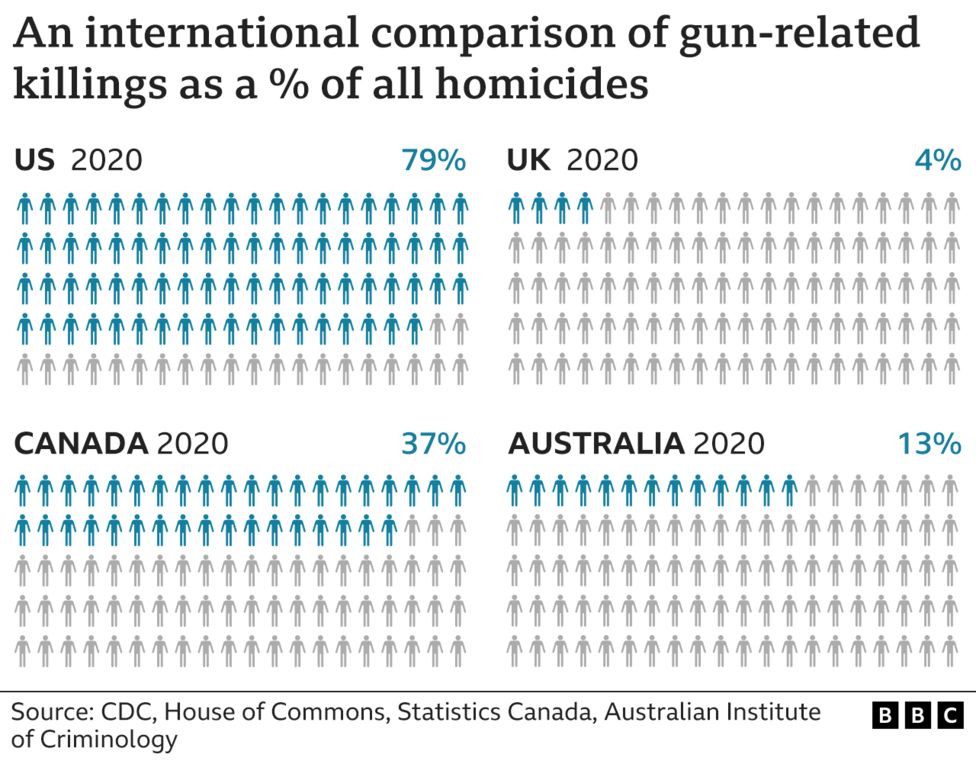
Another shocking fact is that nearly 53 people are killed each day in the country, according to CDC data. 79% of all murders are carried out with guns. This is the highest figure when compared to three other developed countries. Canada is the next worst.

Source: America’s gun culture – in seven charts, The BBC

S&P 500 Intra-year Declines and Year Total Returns 1980 To 2021: Chart

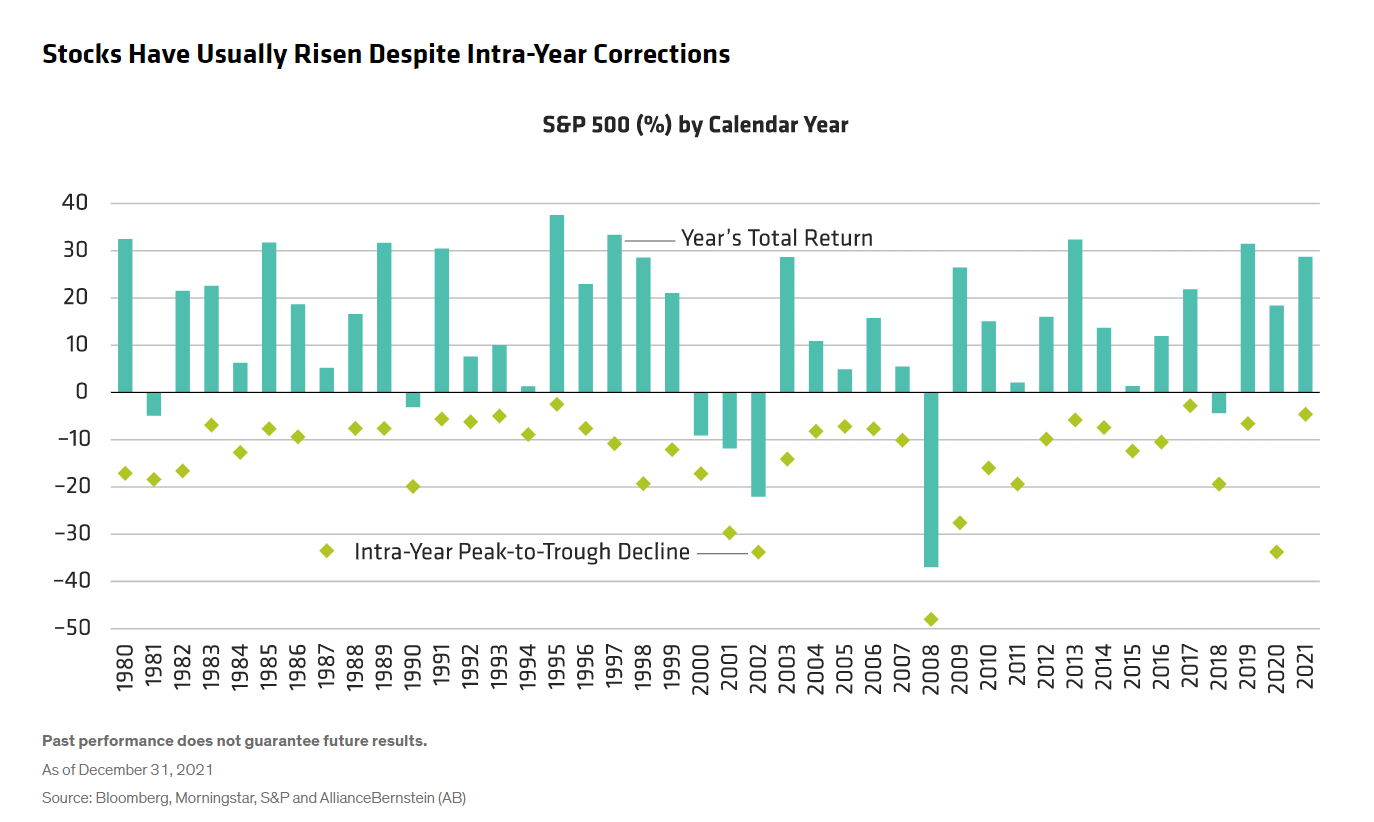
Intra-year declines in the equity markets are a common occurrence. At the risk of stating the obvious, stocks never only go up always. In any given year, stocks decline significantly though the course of the year for any number of reasons but end up the year with a positive total return. Stomach-churning volatility can shake the conviction of even the most patient investors.

The following chart the intra-year declines for the S&P 500 and the yearly total returns for the S&P 500 index from 1980 to 2021:

Click to enlarge

Source: Alliance Bernstein

During the period shown, the S&P  has had negative returns for the year less than 10 times. Moreover consecutive down years in a row are rare. The last time this occurred was after the dot-com implosion.

The key takeaway is that returns for the whole year is what matters. Not the intra-year declines.

Related ETF:

  •  SPDR S&P 500 ETF Trust (SPY)

Disclosure: No positions

Canada S&P/TSX Composite Index Annual Returns 1924 To 2020: Chart

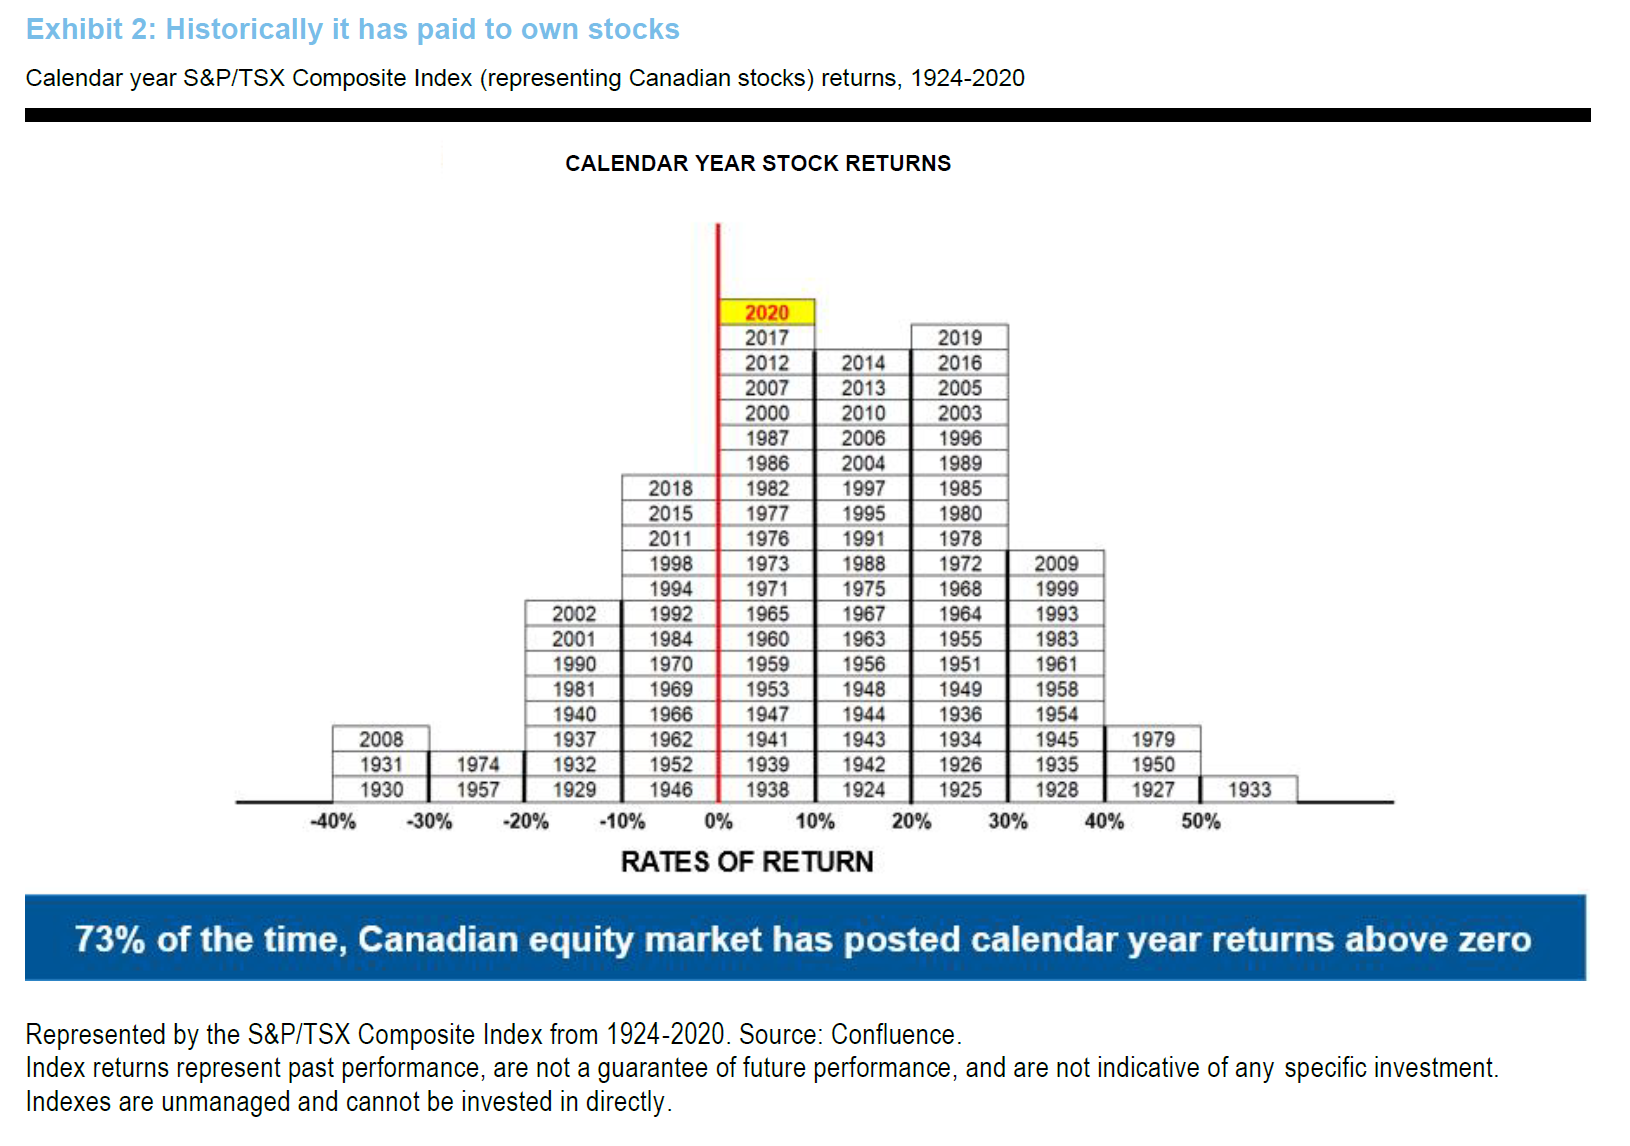
Stocks tend to yield a positive return over the long term. This is true in many equity markets of the world including Canada. From 1924 thru 2020, Canadian stocks as represented by S&P/TSX Composite Index have earned investors a positive return 73% of the time. To put it another way, positive years trump negative returns.

Click to enlarge

Source: 3 guidelines to keep in mind in volatile markets, Russell Investments

Related ETF:

  •  iShares MSCI Canada ETF (EWC)

Disclosure: No positions

Why Invest in Foreign Stocks?

One of the important factors for success with investing in equities is diversification. While diversification can be done in many ways, one way investors can benefit is to own overseas stocks in addition to stocks from their local market. This is because different markets perform differently each year and also putting all assets in a single country including the home market is not a wise idea. For instance, holding emerging market equities can boost portfolio returns due to the higher growth rate usually found in these markets.

Similarly one developed market may be more co-related to the performance of one sector while another may mirror the returns of another sector. For example, the Canadian equity market is mostly co-related to the performance of the energy sector. The Australian market is highly dependent on the mining sector.

With that said, some US investors may avoid investing in foreign stocks due to the belief that it is unnecessary as many large American companies derive a high portion of their revenue from foreign countries. In simple terms, the argument here is that why invest in a British consumer goods firm like Unilever(UL) when an American giant in the same industry such as Proctor & Gamble (PG) has significant overseas operations. This line of thinking does not cover the full picture and is inherently incorrect. To give one reason, the scope, number of countries and the culture of these two firms are different. Many of Unilever’s brands have a strong historical presence and popularity in former British colonies. This is not the case with the brands of P&G.

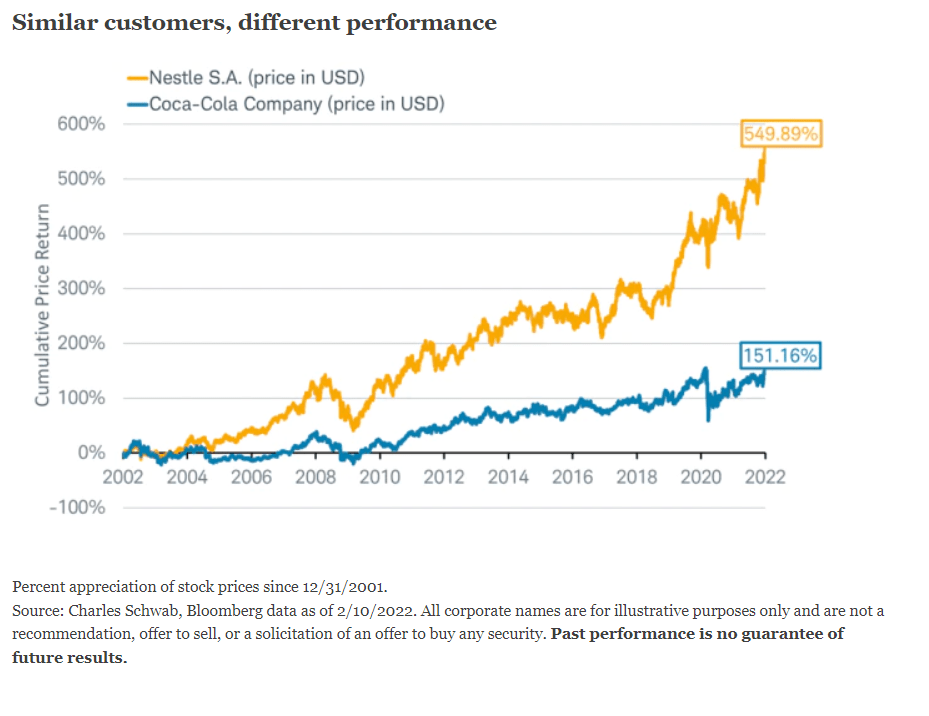
Recently I read an interesting article at Schwab on the importance of investing internationally. The author Jeffrey Kleintop supports his arguments using the example of Nestle and Coca Cola which are in the same sector. From the article:

Big companies in the same sector or industry typically serve the same global customer base. For example, U.S.-headquartered Coca Cola and Nestle, a Swiss-headquartered company, have the same geographic distribution of sales by region, to within a few percentage points. They both get about 25-35% of their revenue from the U.S., about 20% from the rest of the Americas, 20-25% from Europe and another 20-25% from Asia, and about 5-10% from Africa and the Middle East.

Coca-Cola and Nestle both sell beverages and snacks to the same folks around the world. This similarity seems to suggest that there shouldn’t be much difference in the performance of stocks in the same industry that are headquartered inside or outside the United States. But, in truth, there is a difference. Over the 20 years ending in December 2021, Nestle’s stock rose 550%, vastly outpacing Coca-Cola’s gain of 151%. Why? Because there are many factors that drive stock performance besides revenue allocation.

SourceWhy Invest Internationally? by Jeffrey Kleintop, Charles Schwab

The entire linked article above is worth a read.

Referenced stocks:

  • Nestle (NSRGY)
  • Coca Cola(KO)
  • Unilever(UL)
  • Proctor & Gamble (PG)

Disclosure: No positions