The Riskiest Financial Firms In America
Canada showing signs common to asset bubbles: report
No bling, no buzz in Singapore
Why Britain needs to buddy up to the Brics – fast
Stimulus spree leaves China on the edge
US stocks ‘cheap’ despite rally
The S&P; Russia 10 index is comprised of 10 of the largest publicly-traded Russian stocks available to foreign investors through London International Order Book (IOB) GDR Listings.
As a commodity-based economy Russia presents many opportunities in the commodity sector. However as an emerging market with significant political risks, Russian equities can be highly volatile in addition to the general volatility that comes with commodity stocks.
The S&P; Russia 10 index is up 8.4% YTD.The constituents of this index are:
Note: All these stocks are traded on the OTC markes in the US markets and may be illiquid.
In a recent article fellow blogger and portfolio manager, Roger Nusbaum noted that “it is very difficult to build an ETF portfolio that emphasizes dividend yield.” Update: Please note that Roger said the previous statement in the context of building a portfolio with ETFs at the sector level. My article below discusses about using dividend ETFs at the market/index levels.
I came across a paper that discussed this topic in more detail.
The ETF provider iShares(UK) has published a report on using dividend yield ETFs for income. The following are some of the key takeaways from this report:
a) ETFs provide the benefits of dividend investing, combined with the usual advantages of index investing: easy diversification, low costs, transparency and market representativeness.
b) Many factors are considered when building dividend indices.For example, STOXX and Euro STOXX Select Dividend indices screen companies based on dividend per share growth and earnings per share ratios whereas DivDAX uses one-year historic yields.
Methodologies followed by various dividend Indices:
Click to Enlarge

c) iShares offers country-specific and regional dividend ETFs to track the following indices:

d) “There are two key differences between the dividend yield of an index and the distribution yield of the ETF that is tracking that index.
1. The historical fund distribution yield is based on the last 12 months of fund distributions and therefore is NOT EQUAL to the future/expected fund distribution yield
2. The index dividend yield is NOT EQUAL to the fund distribution yield”
e) Dividend ETFs can be used to offset inflation, create regular inflows, enhance portfolio yield and reduce portfolio volatility

To download the Equity Income: Investment and Strategies with iShares ETFs paper, click here.
Related ETFs from iShares(US):
1. Dow Jones International Select Dividend Index Fund (IDV)
12-Month Yield: 3.85%
2. Dow Jones Select Dividend Index Fund (DVY)
12-Month Yield: 3.57%
3.S&P U.S. Preferred Stock Index Fund (PFF)
12-Month Yield: 7.41%
The auto market in the emerging countries of China and India is growing rapidly. For example, in March this year GM sold more cars in China than in the U.S. Many of the major car makers of the world are investing heavily in these countries in order to gain market share.
Imitating the U.S. model, China and India are promoting the growth of the automobile industry. The Financial Times recently wrote:
“China’s car-centred model of development has been a mainstay of economic growth in recent years…the spin-off benefits from burgeoning car sales have been enormous. Each car requires several thousand parts, hundreds – if not thousands – of suppliers, roads, car parks, driving schools, petrol stations and other service industries.”
While auto companies are great for economic development, they are not the best when it comes to making profits. This is especially true for the big three US automakers. However the closely-related oil industry is the most profitable in the world. In 2009, seven of the top ten in the Global 500 rankings were oil companies. The Japanese auotmaker Toyota was ranked at number 10. China’s very own oil major China Petroleum & Chemical Corporation(SNP) was ranked ninth in the list.
An article titled Alan Mulally’s Asian Sales Call in Bloomberg BusinessWeek noted “according to market researcher J.D. Power & Associates (MHP), a third of the world’s auto sales will come from the region spanning China, India, Northeast Asia, Southeast Asia, Australia, and New Zealand.”
The Top Car Companies in China and India based on Market Share:
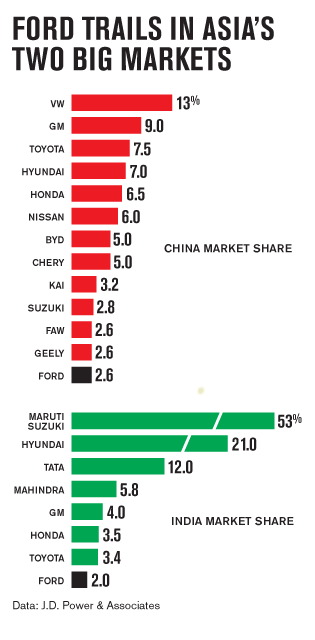
Source: Bloomberg BusinessWeek
It is interesting to see that German auotmaker Volkawagen(OTC: VLKAY)holds the largest market share in China followed by GM(GM) and Toyota(TM). Ford takes the 11th spot together with domestic car companies Geely and Faw. Compared to China, Indo-Japanese joint venture company company Maruti Suzuki holds the largest market share. Ford(F) holds the eighth position.
Greek debt crisis: could it happen in the UK?
Asia’s Best Managed Companies: India and Singapore
MarketWatch is Wrong… Here’s The Case For Investing in Small Caps
ICICI Bank, HDFC Bank are ‘foreign owned, Indian controlled’
Economix: Where All That Money Went
