 Norway is small country with a population of about 4.8 million bordered by Sweden, Finland and Russia. Unlike the American Dream which consists of owning a McMansion in the suburbs, the Norwegian Dream consists of owning two houses – one for living and the other for leisure with a cottage or cabin by sea or in the mountains. Norway’s fortune turned ever since oil was discovered in the North Sea in the late 1960s. Today Norway is the third largest exporter of natural gas, the fourth largest exporter of oil and the second largest exporter of fish in the world. The country consistently ranks high in many global rankings such as Global Competitiveness Index, Human Development Index, etc.
Some of the reasons to invest in Norway are:
1. Norway is a surplus country. The budget surplus last year was 11% of its GDP.
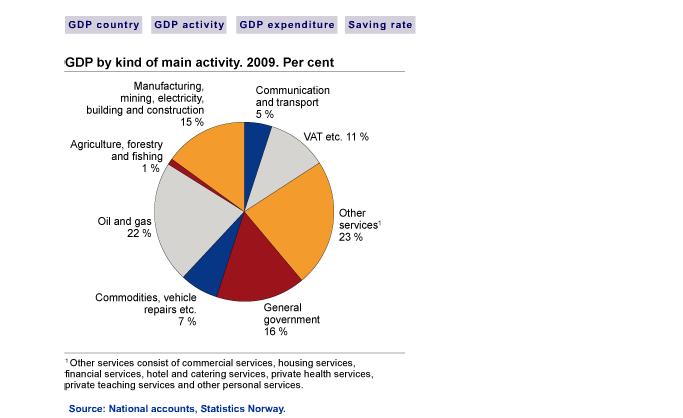
2. Oil and natural gas accounts for about 1/4th of the GDP. Hence the price of oil has a strong impact on the economy. Surplus oil revenue is saved into a sovereign wealth fund that is the second largest in the world with assets of over NOK 2.1 Trillion. Unlike the Persian Gulf countries and UK, Norway does not squander its petroleum wealth by wasteful spending.
GDP Chart
Click to Enlarge
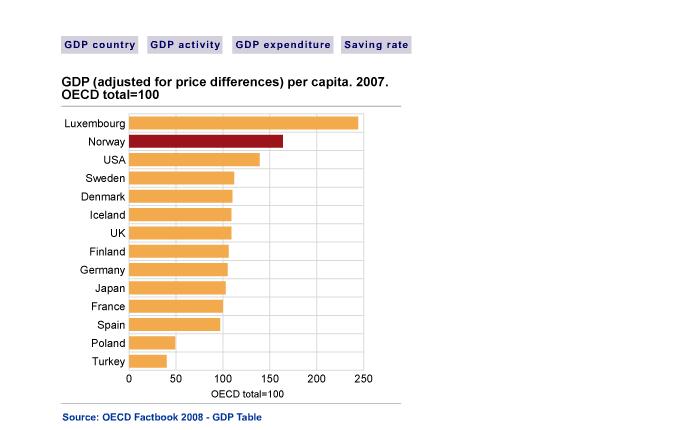
3. Among the developed countries, Norway has the second highest GDP per capita next to Luxembourg at $52,000 per person.
4. The unemployment rate stood at 3.5% in March this year, the lowest among OECD countries.
5. Norwegian banks are highly regulated and did not get involved heavily in the sub-prime mess. The banking industry also represents just 2% of the country’s GDP.
6. Norway consistently attracts strong foreign investments. The energy sector especially draws the most amount of FDI and the countries with the largest FDI are Sweden, USA, UK, Denmark and the Netherlands. In addition, foreign investors hold the second largest ownership positions in listed Norwegian companies second only to the Norwegian government.
7. The government is the largest shareholder in many of the largest companies such as fertilizer maker Yara International (OTC:YARIY), banking group DnBNOR (OTC: DNBHY), aluminum maker Norsk Hydro (OTC: NHYDY), telecom provider Telenor (OTC: TELNY) and oil company Statoil(STO). The largest stocks on the Oslo Stock Exchange are Statoil, DnB NOR, and Telenor.
8. Similar to Canada and Australia, Norway is unique in the sense that it is a developed country with an emerging market type commodity-based economy primarily consisting of oil, metals, fertilizer and seafood.
9. The Norwegian market has performed well since 1900 with an annualized real return of 4.1% per year. Based on P/E ratios Norway looks cheaper. The P/E for Norway is 13.9 compared to 18.0 for Canada, 15.5 for Australia and Germany, 18.8 for Finland, etc.
10. Norway is not part of the European Union and hence is not a member of the European Monetary Union whose members have Euro as their currency.
How to invest in Norway?
Unfortunately there is no country-specific ETF for Norway. However one can gain exposure to Norwegian equities by owning Global X FTSE Nordic 30 ETF(GXF) which has 18% of portfolio invested there. Some of the top holdings of this ETF include Statoil, Telenor and DnB NOR.
Another way to invest in Norwegian stocks is via ADRs. Oil and gas producer Statoil(STO) and oil equipment servicer and distributor Acergy(ACGY) are the only two exchange-listed stocks. A few other companies such as Yara International (OTC: YARIY), Orkla (OTC: ORKLY) trade as sponsored ADRs on the OTC market. The full list of Norwegian ADRs can be found here.
Sources:
Credit Suisse Global Investment Yearbook, 2010
Thriving Norway Provides an Economics Lesson
http://www.nortrade.com
Statistics Norway


