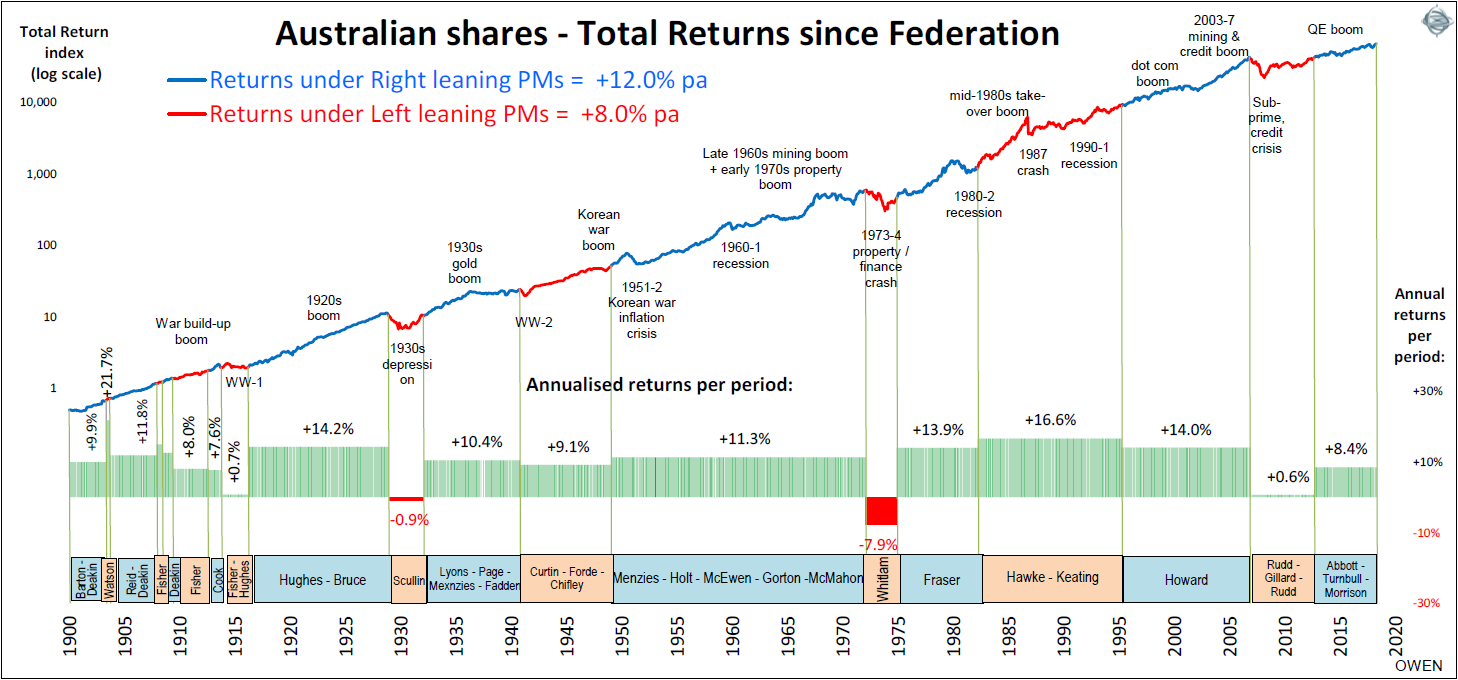
The Case for Bonds: Chart

Fixed income is an important asset class to own in a well diversified portfolio. Though bonds do not offer the thrill of stocks and potential high returns, they provide stability and earn a decent income during good times and bad. For instance, in a prolonged bear market for equities even dividends can get suspended or reduced. Bonds will provide a consistent source of income during such periods without interruptions. When equity markets become volatile investors try to seek shelter in bonds and other relatively safe assets. The following chart from PIMCO shows the diversification benefits of owing bonds:

Click to enlarge

Source: PIMCO

Related ETFs:

  • iShares iBoxx $ Investment Grade Corporate Bond ETF (LQD)
  • iShares TIPS Bond ETF (TIP)
  • Vanguard Total Bond Market ETF (BND)
  • iShares Core Total U.S. Bond Market ETF (HYG)
  • SPDR® Barclays High Yield Bond ETF (JNK)

Disclosure: No positions

The Periodic Table of Commodity Returns 2021: Chart

Commodities had one of the best years last year in recent history. The dramatic recovery in crude oil prices led to crude ending the year with a 55% gain. Natural gas was up about 47%. The best performing commodity was coal with a return of over 160%. Despite the rising popularity of renewables coal is still the king in some countries including Germany. Gold ended the year with a loss of about 4%.

The following chart shows the annual returns of select commodities from 2012 to 2021:

Click to enlarge

Source: U.S. Global Investors

For an interactive version of the above chart go here.

The Top Three Producers of Clean Energy Metals

The world is transitioning to clean energy at a rapid pace. Many countries are planning to reduce their carbon footprint. As the transition to a newer world gains traction the demand for clean energy commodities would go up. The traditional fossil fuel-based automobiles are increasingly replaced by electric vehicles. Coal powered electric power plants are getting shutdown and replaced by renewable energy produced from sources such as solar or wind. The commodities needed for the transition to clean energy are concentrated in a handful of countries.

The chart below shows the top three producers of clean energy metals – Copper, Nickel, Cobalt, Rare Earths and Lithium.  Chile is the world’s largest copper producer but the country just recently elected a leftist leader. Similarly the Democratic Republic of Congo is the top producer for cobalt. Australia is a top lithium producer but 70% of the world’s Lithium reserves are found in the Lithium Triangle formed in an area at the intersection of Chile, Bolivia and Argentina.

Click to enlarge

Source: 2021 IN CHARTS, Mirabaud Asset Management

Developed Markets Annual Returns By Country From 2007 To 2021: Chart

International stocks offer investors the benefit of diversification and also the potential to boost returns. US investors looking to diversify can easily add other developed market equities. For instance most of Western Europe have excellent firms that are equally good if not better than their American peers. Moreover many of the large cap companies trade on the US markets as well. So it is a wise strategy to not only own US stocks but also add a bunch of developed market equities to a portfolio. From a global energy giant based in the UK to a chemical maker in Germany and and railroads in Canada the universe of investment choices available is huge.

The chart below shows the annual total returns of developed market country returns from 2007 to 2021 based on the MSCI index for each country:

Click to enlarge

Note: Returns shown above are based on the respective MSCI Index Total Annual Returns (includes dividend reinvestment) in US Dollar terms.

Source: Novel Investor

Last year Austria was the best performer with a total return of over 42% followed by the Netherlands and Canada. Canada was boosted by the strong recovery in energy prices in 2021. These returns are comparable to the returns of the S&P 500 which had a total return of 28% last year.

Related ETFs:

  • iShares MSCI Germany Index Fund (EWG)
  • iShares MSCI Canada Index Fund (EWC)
  • iShares MSCI Australia Index Fund (EWA)
  • iShares MSCI United Kingdom Index (EWU)
  • iShares MSCI Singapore Index (EWS)

Disclosure: No positions

Most Brazilian ADRs Are Trading Under $10 a Share

“Brazil, Land of the Future and always will be!” – Charles de Gaulle

Brazil used to be one of the best emerging markets a few years ago. As one of the BRIC countries Brazil had everything going it relative to others. But then politics and other factors turned Brazil one of the basket cases – at least from the standpoint of international investors. Brazil seems be one of those countries that is always emerging and never able to get to the next level. Maybe Brazil is destined to suffer from the natural resource curse just like some nations are cursed by  the abundance of oil.

Last year Brazil was one of the worst emerging markets. The Bovespa index had a negative return of about 12% on price only basis. The MSCI total return for Brazil was down by 17% for 2021 and 19% loss in 2020. So two years in a row Brazil let down investors.

With that said as I looking into Brazilian ADRs, one thing stood out. Among the 23 or so stocks trading on the US exchanges, just 6 are trading above $10 a piece. Rest of going for under $10 with many selling for under $5. This is indeed shocking. For instance two of the largest private sector banks – Banco Bradesco(BBD) and Itau Unibanco (ITUB) – closed at $3.57 and $3.98 per share last Friday. The following table shows the closing prices of exchange-listed Brazilian ADRs:

S.No.ADR NameTickerEnd price on Jan 7, 2022Year-To-Date % Change as of Jan 7, 2022Industry
1AMBEV S.AABEV$2.59-7.50%Beverages
2AzulAZUL$12.80-3.03%Travel & Leisure
3Banco BradescoBBD$3.574.39%Banks
4Banco Santander BrasilBSBR$5.563.54%Banks
5BrasilAgroLND$5.10-5.56%Real Estate Inv&Serv
6BraskemBAK$18.70-11.33%Chemicals
7BRF S.A.BRFS$4.243.67%Food Producers
8Centrais Eletricas BrasileirasEBR$5.39-11.49%Electricity
9Companhia Brasileira de DistribuicaCBD$3.40-14.79%Food &Drug Retailers
10Companhia Energetica de Minas Gerais-CEMIGCIG$2.20-9.47%Electricity
11Companhia Paranaense de Energia-COPELELP$5.26-6.57%Electricity
12Companhia Siderurgica Nacional-CSNSID$4.25-4.28%Indust.Metals&Mining
13EmbraerERJ$17.03-4.06%Aerospace & Defense
14GerdauGGB$4.87-1.02%Indust.Metals&Mining
15Getnet Adquirencia e Servicos para Meios de Pagamentos S.A.GET$1.35-3.57%Financial Services
16Gol LinhasGOL$5.67-6.28%Travel & Leisure
17Itau UnibancoITUB$3.986.13%Banks
18Natura & Co HoldingNTCO$7.84-15.43%Personal Goods
19Petroleo Brasileiro-PetrobrasPBR$11.010.27%Oil & Gas Producers
20SABESPSBS$6.34-13.62%Gas,H20&Multiutility
21Suzano S.A.SUZ$10.54-2.41%Forestry & Paper
22UltraparUGP$2.36-10.61%Gas,H20&Multiutility
23ValeVALE$14.815.63%Indust.Metals&Mining

Source: BNY Mellon

Disclosure: Long BBD, ITUB and PBR