On July 23rd European regulators will release the results of the stress tests which measures the ability of Europe’s bank to withstand future economic shocks. In the U.S., similar stress tests were conducted last year and for the most part the results were positive.
Some of the Eurozone banks with strong capital levels and exposure to markets outside of Europe include Spain’s Banco Santander (STD), Dutch banking giant ING Group (ING) and France’s BNP Paribas (BNPQY).These banks have been hit hard like other banks as investors fled European bank stocks due to many uncertainties. If the EU stress test results are good, then European banks may rally as the results may provide a boost to the market.
The latest edition of IMF’s Global Financial Stability Report contains the Bank Capital as a percentage of Assets for most of the countries. Hence higher ratio is good. The chart below shows the bank capital to asset ratio for the major Euro zone countries:
Click to Enlarge
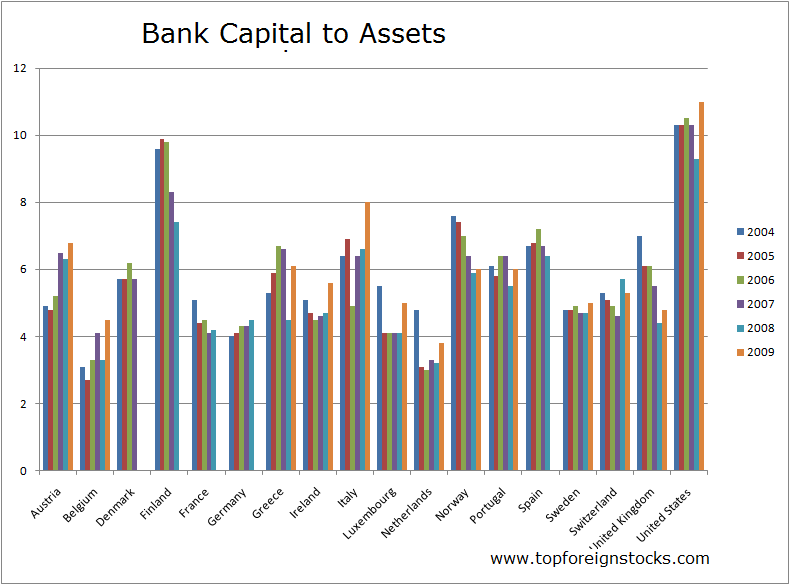
Data Source: IMF
Note: U.S. is included in the chart for comparison purposes; 2009 data for some countries is not available
US banks have higher capital than most European banks. This is because unlike Europe, banks in the U.S. raised their capital levels last year with the help of TARP funds, issuance of new equity and other ways.European companies have traditionally been reluctant to raise capital by issuing new equity.