S&P 500 Index Bull and Bear Markets Since 1966

US equity markets were up big yesterday. However we are still in a bear market and after weeks of down days it was more of a relief rally. Moreover volume was lower than average for a few stocks I looked at. Stocks going up on low volumes is not a strong indicator of the strength of the rally. Even if we ignore the rally yesterday and take a high-level overview of the markets, bear markets do not last forever, Historically stocks tend to go higher in the long term as measured in years and decades. While stocks can be volatile in the short-term, ultimately volatility subside and stocks restart their upward trend.

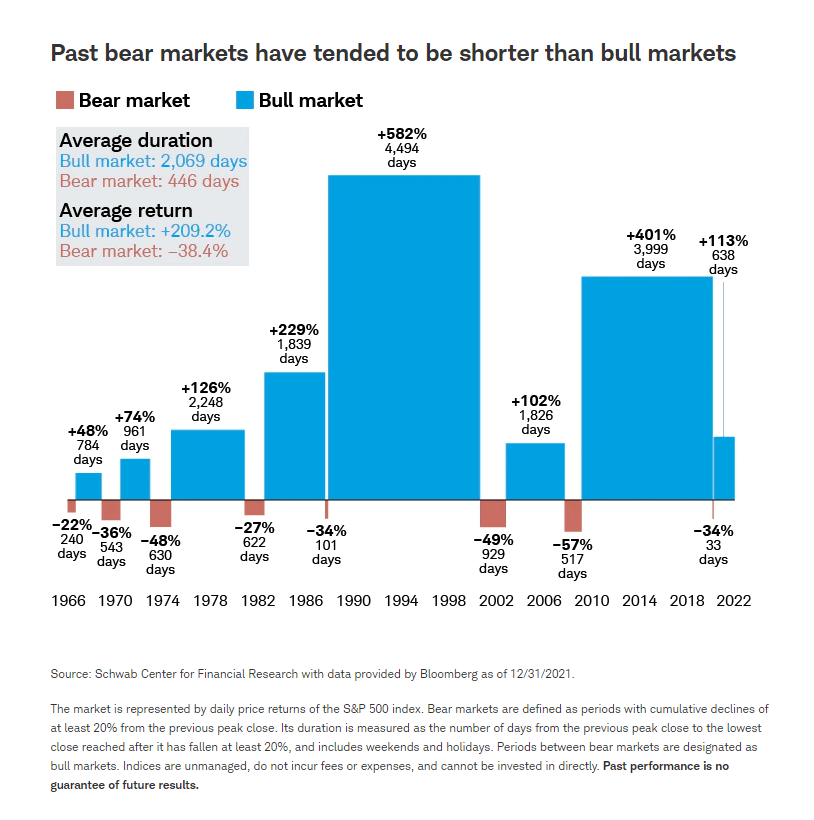
With that said, a recent article at Schwab noted that bear markets tend to be shorter than bull markets based on their research since the late 60s. From the article:

Historically, the stock market has always returned to its previous peak after a bear market, usually within a few years. The Schwab Center for Financial Research looked at both bull and bear markets for the S&P 500® Index going back to the late ’60s and found that the average bull ran for about six years, while the average bear market lasted roughly 15 months. The longest bear market lasted about two and a half years. The shortest was the pandemic-fueled bear market in early 2020, which lasted a mere 33 days.

Click to enlarge
Source: Bear Market: Now What?, Schwab

While it is impossible to predict when the current bear market will end, it is a wise idea to monitor the market and take advantage of cheaper prices. One way to gain exposure to the boarder market is via the SPDR S&P 500 ETF (SPY). However for investors that already own individual stocks, a smart strategy is to follow the Dollar Cost Averaging model and nibble when markets decline heavily.

Below are a few stocks that investors can consider for further research and consider for potential investment:

  • General Mills Inc (GIS)
  • Lear Corp (LEA)
  • Canadian Pacific Railway Ltd(CP)
  • Edison International (EIX)
  • General Dynamics Corporation (GD)
  • Bank of Hawaii Corporation (BOH)
  • Cullen/Frost Bankers, Inc. (CFR)
  • TELUS Corp (TU)
  • Amphenol Corp (APH)

Disclosure: Long GIS
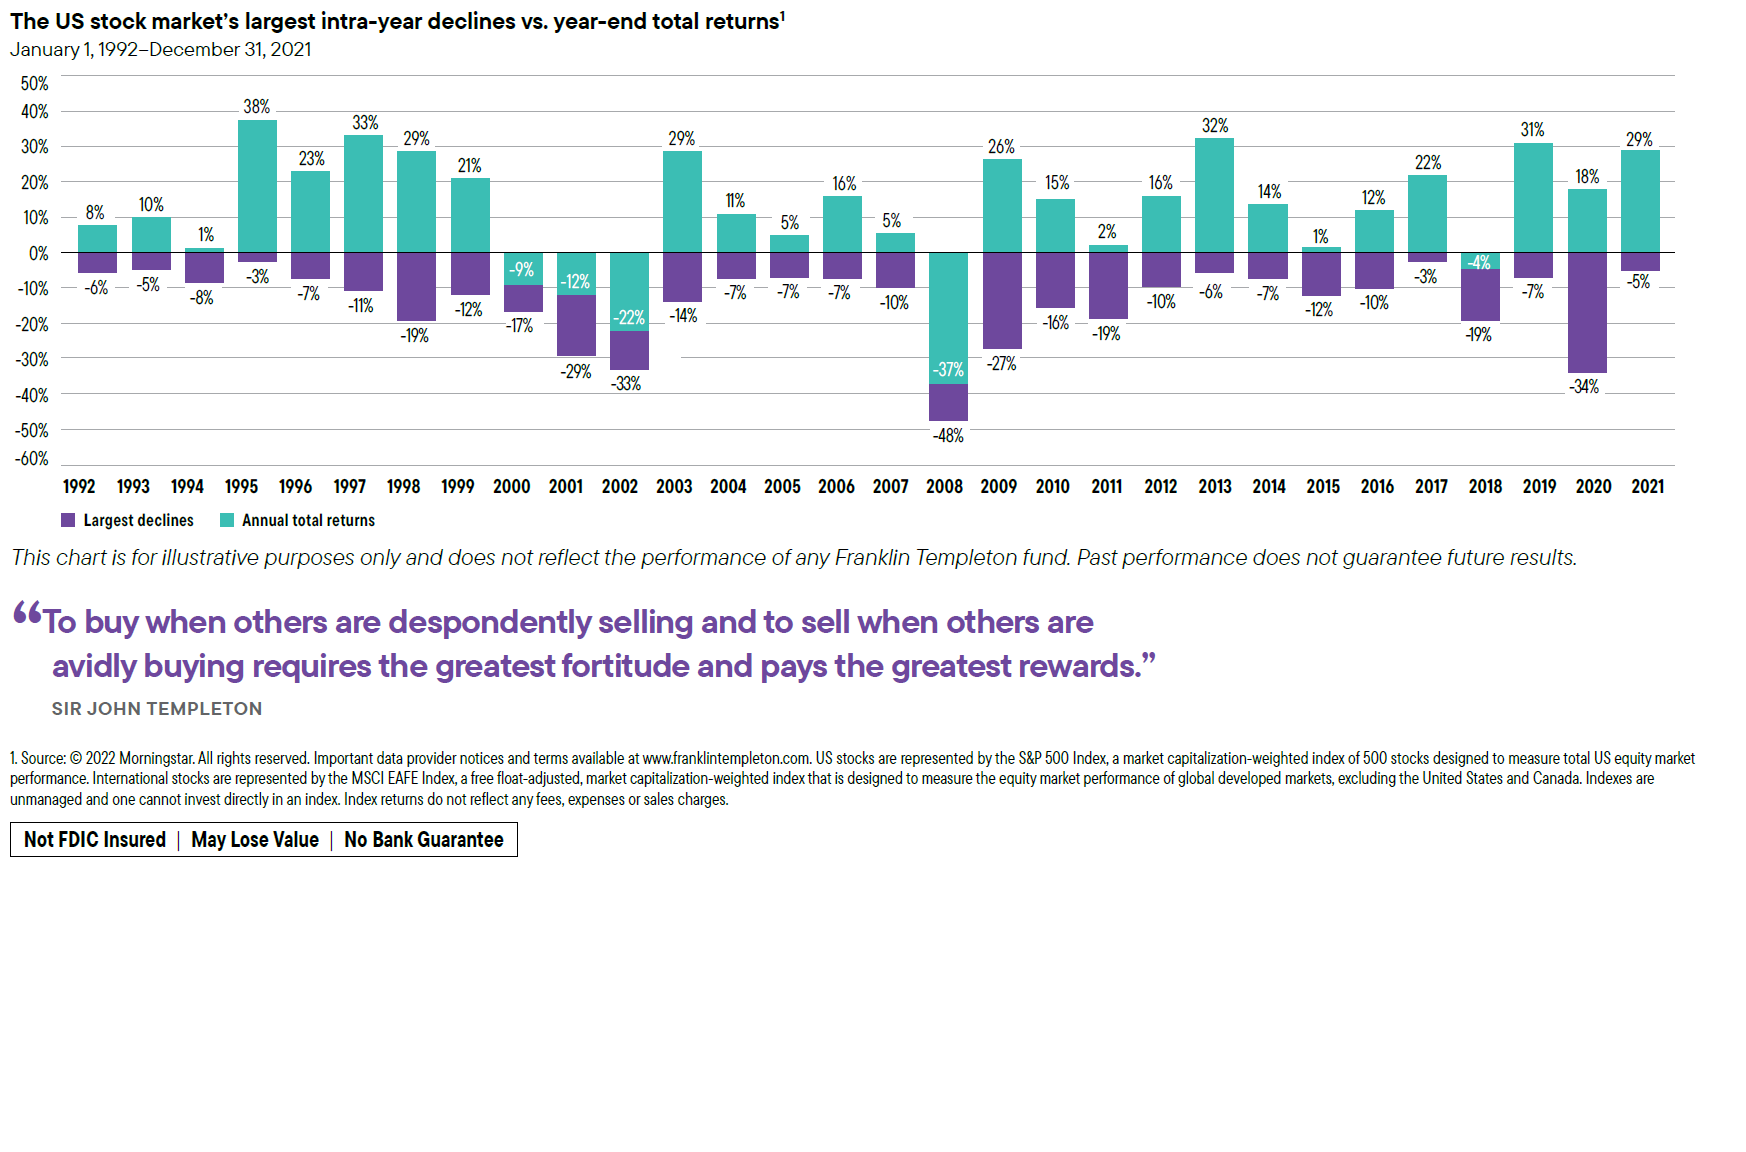
S&P500 Largest Intra-Year Declines and Year-end Total Returns 1992 to 2021: Chart

We looked at the case for staying invested in foreign stocks in an earlier post. In this post, let’s review a chart showing the importance of staying invested in US stocks as represented by the S&P 500. From 1992, though the index has had many years of big intra-year declines, the S&P 500 had positive returns in 25 out of the past 30 years.

S&P500 Intra-Year Largest Declines and Year-end Total Returns 1992 to 2021:

Click to enlarge

SourceThe Power of Perseverance, Franklin Templeton

Related ETFs:

  1. SPDR S&P 500 ETF (SPY)
  2. iShares Core S&P 500 ETF (IVV)
  3. Vanguard S&P 500 ETF (VOO)
  4. SPDR Portfolio S&P 500  ETF (SPLG)

Disclosure: No positions

The Case For Staying Invested: International Stocks Example

I have written many times in the past on the importance for staying invested for the long haul. Having patience and staying focused on the long-term goals is especially difficult during adverse market conditions such as the bear market we are currently in. Simply quitting the market by selling everything and staying on the sidelines will not be helpful to say the least. This is because it is foolish to sell when stocks are their lowest levels. In addition, while selling is easy buying back at the bottom is not. Markets can turn almost overnight and it is impossible to predict when is the right time to jump back in. So to put it another way, in order to time the market one has be right two times – once to sell and another to buy back again. For most investors this is not humanly possible – especially being right twice.

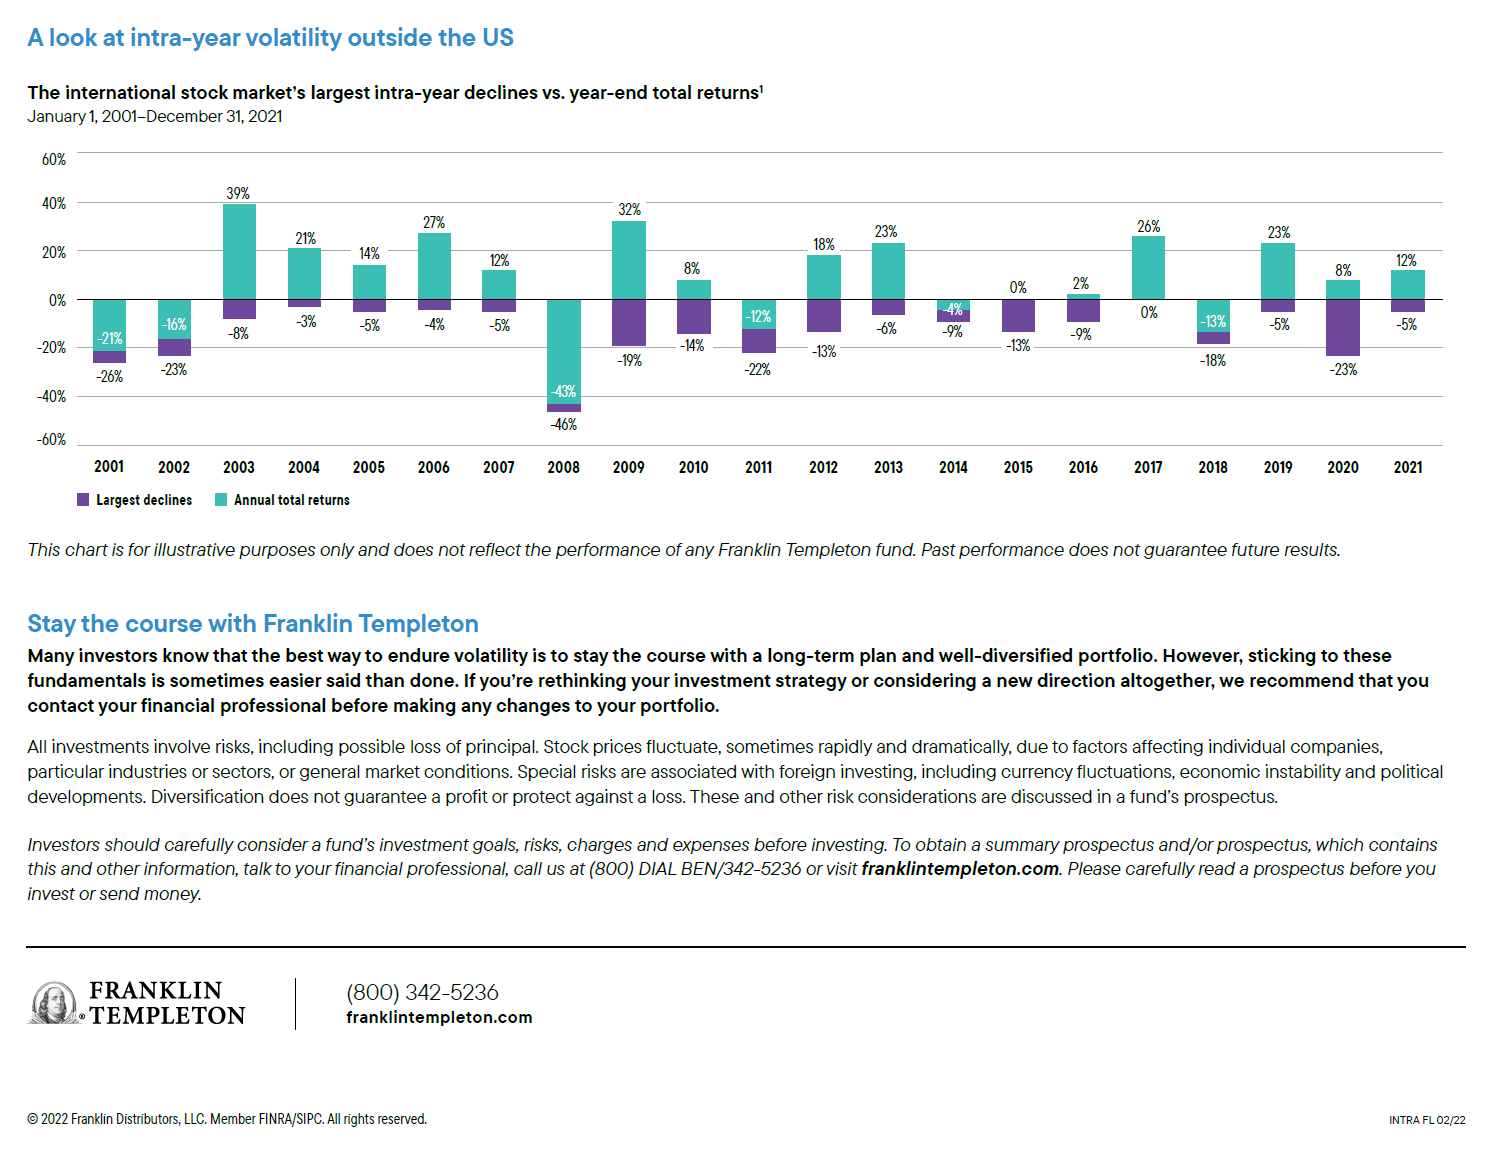
Similar to the popular chart for the S&P 500, the following chart shows the largest intra-year declines and the year-end returns for international stocks as represented by the MSCI EAFE Index. Definition of this index from MSCI:

“The MSCI EAFE Index is an equity index which captures large and mid cap representation across 21 Developed Markets countries around the world, excluding the US and Canada. With 799 constituents, the index covers approximately 85% of the free float adjusted market capitalization in each country.”

The MSCI EAFE Index’s largest intra-year declines vs, year-end total returns from 2001 to 2021:

Click to enlarge

Source: The Power of Perseverance, Franklin Templeton

The above chart shows that perseverance pays off. For instance, in 2020 international stocks declined by 23% but still ended the year with a positive total return of 8%. Similar scenario has occurred over the years from 2001.

Related ETF:

  • Vanguard Developed Markets Index Fund ETF (VEA)

Disclosure: No positions

S&P 500 Sector Returns Chart – First Half 2022

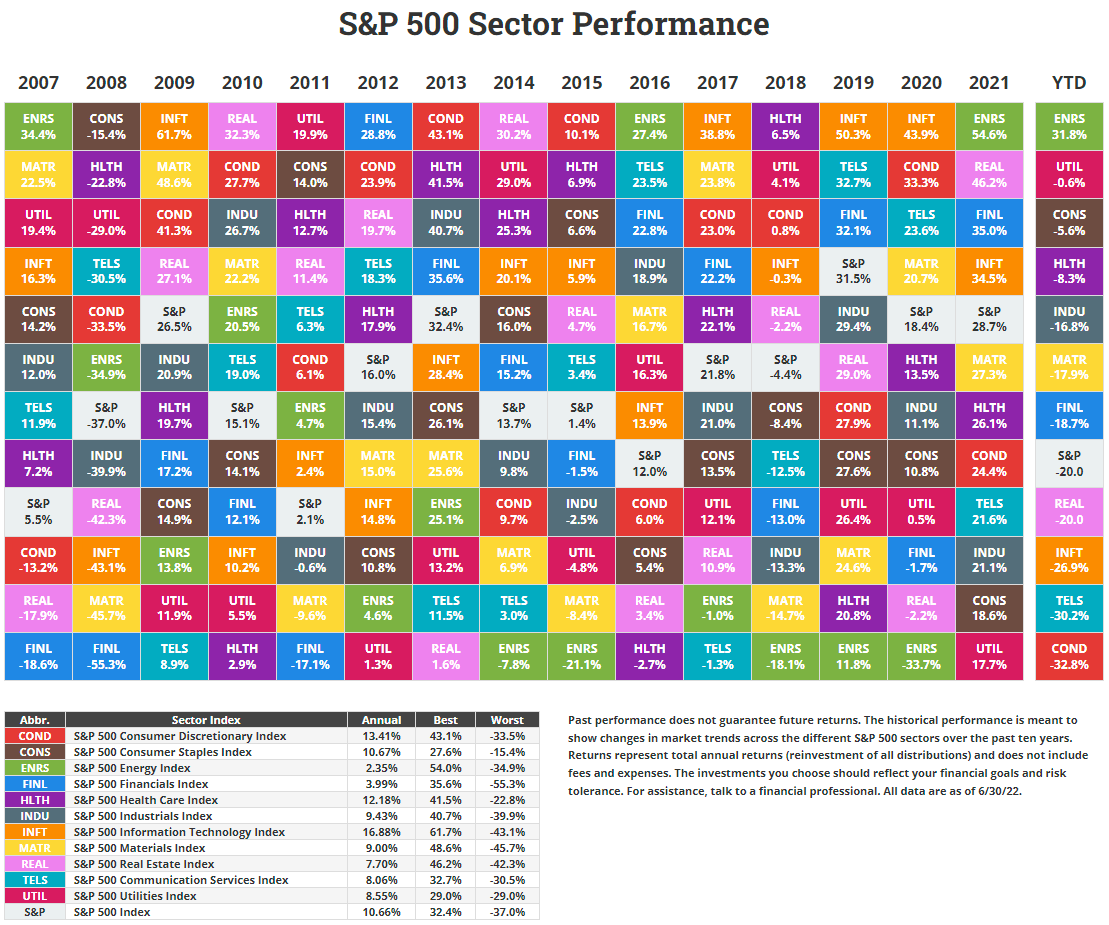
Novel Investor has updated the sector returns chart for the S&P 500 for the first half of year 2022. This chart shows the annual returns of the various sectors of the S&P 500 together with the current year data.

With bear market raging across the equity market, the best performing sector this year has been the energy sector with a return of over 31%. This follows the best performance of the sector in 2021. The other sectors that have relatively performed better so far this year include: utilities, consumer staples and health care.

On the other hand, the worst performing sector is consumer discretionary followed  by communication services and information technology. All these have declined much more than the S&P 500 as shown in the chart below:

Click to enlarge

Source: Novel Investor

Related ETFs:

  1. SPDR S&P 500 ETF (SPY)
  2. iShares Core S&P 500 ETF (IVV)
  3. Vanguard S&P 500 ETF (VOO)
  4. SPDR Portfolio S&P 500  ETF (SPLG)

Disclosure: No positions