ADRs Going Ex-Dividend in June

The following table lists the ADRs going Ex-Dividend in the month of June together with their current dividend yields:

[TABLE=951]

China Digital Tv Holding Co Ltd (STV) declared a special cash dividend of 56 cents a share payable in around December 30th to shareholders of record on June 20. This is the 3rd dividend payment since its IPO in 2007.

Note: Dividend yield is as of May 27, 2011

Disclosure: Long BBD, ITUB
Total Number of U.S. Listed Stocks vs. Mutual Funds – Which One is Higher?

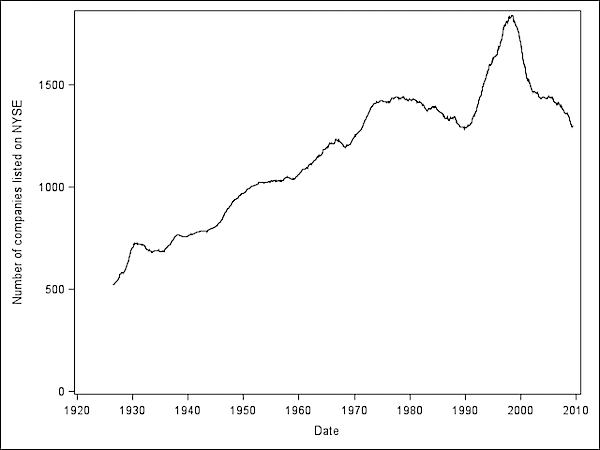
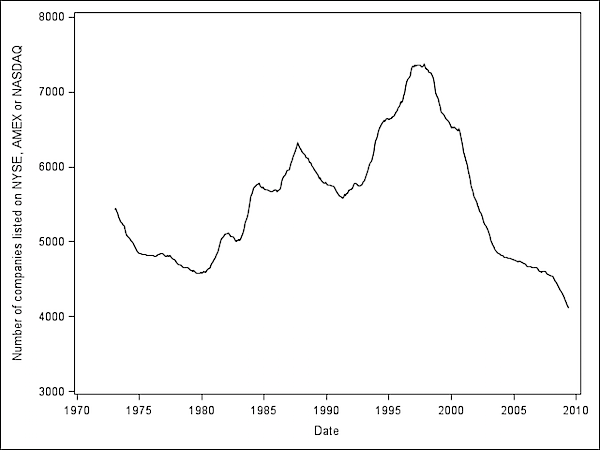
The total number of stocks listed on the U.S. exchanges has declined for many years now following the dot-com bubble. However the total number of mutual funds listed remains very high.

Number of Companies listed on the organized U.S. Exchanges:

sgplot4.png

Number of Companies listed on the NYSE:

sgplot8.png

Source: via Felix Samon @ Reuters

From U.S. Falls Behind in Stock Listings in The Wall Street Journal:

A combination of mergers, fewer U.S. IPOs, lower listing costs abroad and a shift in how investors and stockbrokers do their jobs has driven down the number of U.S. stock listings by a startling 43% since the peak in 1997—all during a period when the number of listings outside the U.S. has more than doubled.

The result is some 3,800 fewer companies trade on the U.S. exchanges today than in 1997, according to consulting firm Capital Markets Advisory Partners. Abroad, there are nearly eight times as many listings as in the U.S., with Hong Kong, China and India among the leading venues. (emphasis added)

Currently there are about  2,760 companies trading on the NASDAQ and 2,312 on the NYSE.

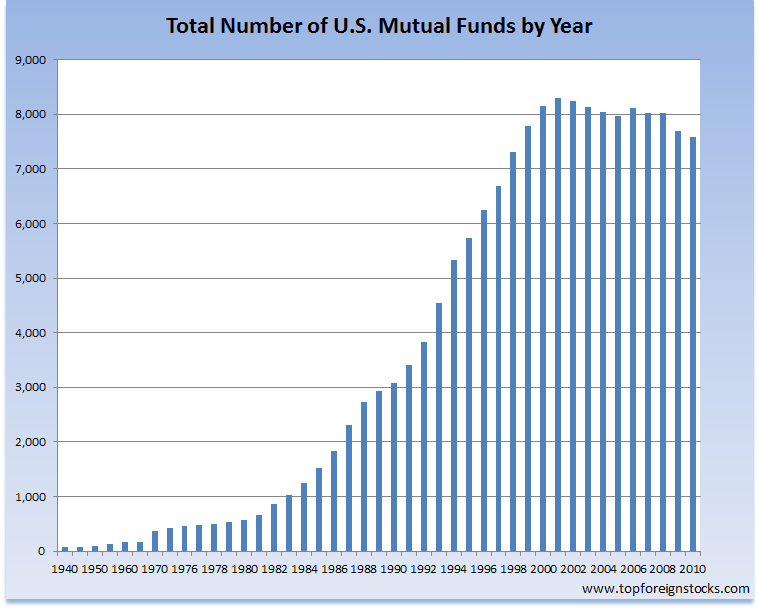
Even as the total number of U.S. listings are declining, the total number of mutual funds trading on the U.S. markets remains very high as shown in the chart below:

Click to enlarge

total-number-of-mutual-funds-usa-2010.png

Source: Investment Company Institute

Most investors are not aware that there are more mutual funds than stocks trading on the U.S. markets. From a total of 564 funds in 1980 the mutual funds industry has had an explosive growth and reached a peak of 8,305 funds in 2001 during the height of the dot com mania. At the end of 2010, there were still 7,581 funds with an asset base of about $11.8 Trillions. Among these 7,581 funds, investors have a bewildering array of share classes to choose from, the total of which reached 21,971.One of the reason for the existence of so many mutual funds is the amount of enormous profits generated by fund companies in the form of management fees and other expenses.

10 Foreign Stocks Under $10

The following 10 foreign stocks have stock prices under $10:

1.Company:Telecom Corporation of New Zealand (NZTCY)
Current Stock Price: $9.74
Sector:Telecom
Country:New Zealand

2.Company:Aegon (AEG)
Current Stock Price: $6.63
Sector: Life Insurance
Country: The Netherlands

3.Company: Sappi (SPP)
Current Stock Price: $5.14
Sector:Forestry & Paper
Country: South Africa

4.Company:Bbva French Bank (BFR)
Current Stock Price: $8.82
Sector: Banking
Country: Argentina

5.Company:Grupo Radio Centro (RC)
Current Stock Price: $8.65
Sector: Media
Country: Mexico

6.Company: Cemex  (CX)
Current Stock Price: $8.37
Sector: Construction & Materials
Country: Mexico

7.Company: Edenor  (EDN)
Current Stock Price: $8.85
Sector: Electric Utility
Country: Argentina

8.Company:Alumina (AWC)
Current Stock Price: $9.64
Sector: Industrial Metals&Mining
Country: Australia

9.Company:Enel SpA (ENLAY)
Current Stock Price: $6.70
Sector: Utility
Country: Italy

10.Company:Turkiye Garanti Bankasi AS (TKGBY)
Current Stock Price:$4.47
Sector: Banking
Country: Turkey

Italian utility Enel Spa(ENLAY) has a $63 billion market cap and a 7.59% dividend yield.Mexico’s Cemex is one of the large global manufacturers with operations in many countries.

Note: Prices mentioned above are as of May 26, 2011

Disclosure: No positions

Tigers nest taktsang monastery

Tigers nest taktsang monastery, Bhutan

Top 10 Global Paint Makers

The Top 10 Global Paint Makers in 2010 are listed below:

1.Company:Akzo Nobel NV (AKZOY)
Country: The Netherlands
2010 Sales: $16.1 Billion

2.Company: PPG Industries Inc (PPG)
Country: USA
2010 Sales:$13.7 Billion

3.Company:Sherwin-Williams Co (SHW)
Country:
2010 Sales:$9.1 Billion

4.Company:DuPont Performance Coatings (DD)
Country: USA
2010 Sales: $33.9 Billion

5.Company:BASF Coatings (BASFY)
Country: Germany
2010 Sales: $79.6 Billion

6.Company:The Valspar Corp. (VAL)
Country: USA
2010 Sales: $3.6 Billion

7.Company:Kansai Paint Co., Ltd.
Country: Japan
2010 Sales: N/A

8.Company:RPM International Inc (RPM)
Country: USA
2010 Sales: $3.4 Billion

9.Company:Nippon Paint Co.
Country: Japan
2010 Sales: N/A

10.Company:Jotun
Country: Norway
2010 Sales: N/A

Source: Paint & Coatings Industry magazine

Disclosure: No positions

Comparing Income Tax Rates Among OECD Countries

The OECD recently published its annual report on income taxes in OECD countries. The report titled “Taxing Wages” shows that the tax burden on employment income rose in 22 of the 34 OECD countries in 2010. However the rise in most cases was small.

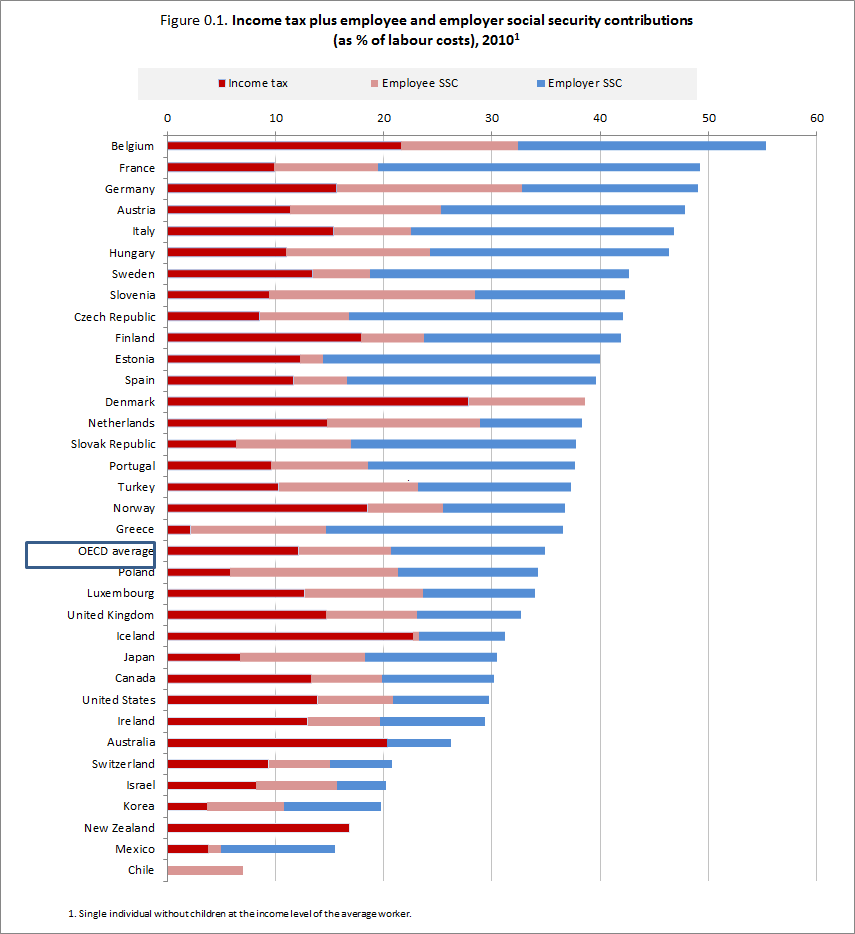
Income Tax Rates for one-earner married couples with two children earning the average wage in OECD countries:

Click to enlarge

tax-rates-oecd.png

Source: OECD

The OECD report noted the following:

Taxes on wages, including both employer and employee social security charges, are a key factor in companies’ hiring decisions and individuals’ incentives to work. As part of efforts to restore public finances and put the economy on a higher growth path, governments should consider shifting the tax mix away from direct to indirect taxes (e.g. by increasing recurrent taxes on immovable property) and broadening the VAT and personal income tax base by eliminating tax expenditures, rather than increasing personal income tax rates and social security charges.

Definition of “Tax Wedge”:

The “tax wedge” is calculated as the total taxes paid by employees and employers net of cash transfers received divided by the employer’s total payroll costs.

Some key takeaways from the report:

  • Belgium, France and Italy were the highest-tax countries for one-earner married couples with two children earning the average wage.
  • New Zealand had the smallest tax wedge for one-earner married couples with 2 children earning the average wage (-1.1%) followed by Chile, Switzerland and Luxembourg. The average tax wedge for OECD countries was 24.8%.
  • Ireland increased income taxes and the health levy while it reduced child benefits. The impact of these changes on the tax wedge has been partly offset by the decrease in the average wage. Because of the progressivity of tax regimes, lower earnings mean that a smaller share is taken in tax by the government.
  • Similar to Ireland, in Greece the strong decrease in the average wage resulted in a decrease in the tax wedge for all families. This is despite of the increase in marginal income tax rates at higher income levels.
  • The countries of Australia, Chile, Iceland, Israel, Italy, Mexico, the Netherlands, Norway, Poland, the Slovak Republic and Switzerland put large additional burdens on employment costs through compulsory payments which are not regarded as tax, since they are not paid to government, but to privately-managed pension funds or insurance companies. Often, these are paid by the employer, but in Chile, Iceland, Israel, the Netherlands, Poland and Switzerland a large proportion of this payment is paid by employees.
  • The U.S. income tax rate is lower than the OECD average as shown in the chart above.