Review: The United Kingdom Dividend Achievers Index

Mergent’s Indxis has created a Dividend Achievers Index for the UK. The index is weighted using a free float adjusted market capitalization and is reconstituted once a year.The index is composed of 99 British stocks.

The components of the index are selected based on the following criteria:

  • Companies must incorporated in the United Kingdom.
  • Stocks must have paid increasing regular cash dividends in their respective local currency for 5 or more consecutive years.

The UK Dividend Achievers Index has yielded better returns compared to the MSCI UK Index. In the past 1 year, this index has grown by 22% while the MSCI index is up about 16%. YTD the index is up over 4% while the MSCI index is flat.

Ten components of The UK Dividend Achievers Index trading on the US markets as ADRs are listed below with their current dividend yields:

1.Company:Vodafone Group PLC (VOD)
Current Dividend Yield: 6.97%
Sector: Telecom

2.Company:British American Tobacco PLC (BTI)
Current Dividend Yield: 5.91%
Sector:Consumer Staples

3.Company:AstraZeneca PLC (AZN)
Current Dividend Yield: 7.13%
Sector:Health Care

4.Company:BHP Billiton PLC (BHP)
Current Dividend Yield: 2.35%
Sector:Materials & Processing

5.Company:Tesco PLC (TSCDY)
Current Dividend Yield: 1.96%
Sector:Consumer Staples

6.Company:Diageo PLC (DEO)
Current Dividend Yield: 2.39%
Sector:Consumer Staples

7.Company:Unilever PLC (UL)
Current Dividend Yield: 4.12%
Sector:Consumer Staples

8.Company:National Grid PLC (NGG)
Current Dividend Yield: 7.40%
Sector:Utilities

9.Company:Scottish & Southern Energy PLC (SSEZY)
Current Dividend Yield: 3.15%
Sector:Utilities

10.Company:Prudential PLC (PUK)
Current Dividend Yield: 4.67%
Sector: Life Insurance

To download the full components of The UK Dividend Achievers Index in Excel format click here.

Disclosure: No positions
Back to more Stock Lists

Currency Movements Benefit Foreign Stocks in the Long-Term

One of the risks of investing in foreign stocks is the exchange-rate risk. For example, the movement of the domestic currency where the stock is listed against the US dollar can adversely or positively impact the return of that investment for US-based investors. A strengthening of the dollar reduces foreign stock returns to US investors as the local returns becomes less when converted to US dollars. Conversely  a weaker dollar leads to higher returns for US investors.

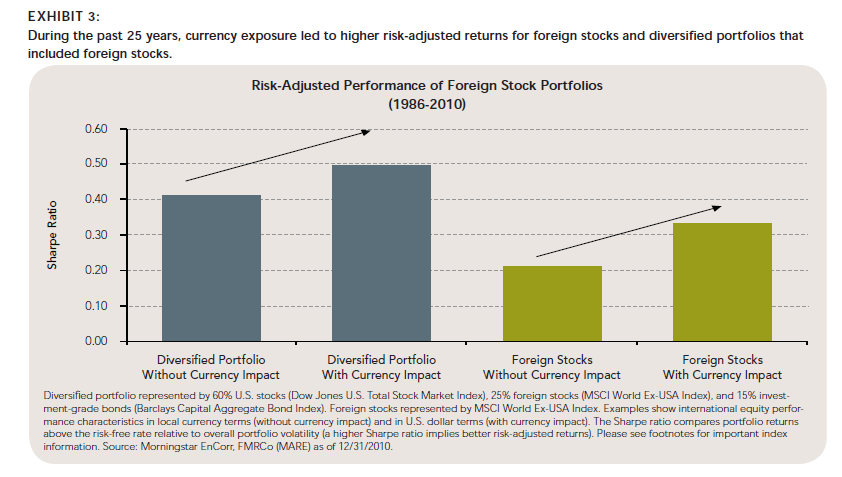
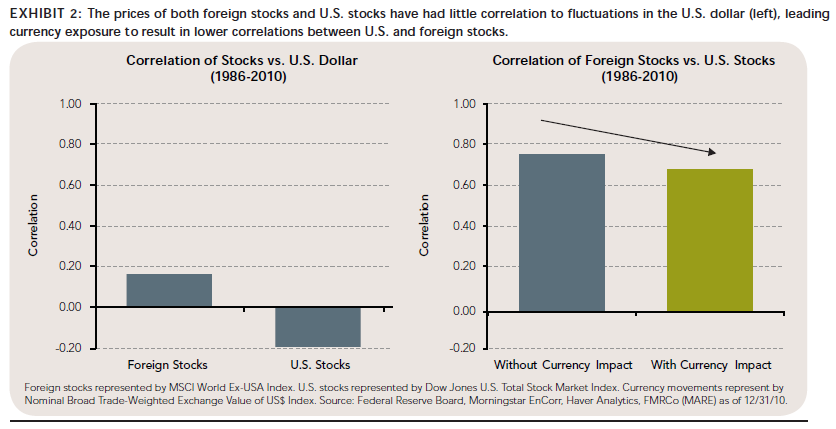
Some investors simply avoid exposure to foreign stocks due to this risk in addition to other factors. However a research report by Fidelity shows that over the long-term currency moves actually benefits foreign stocks and improves the risk-adjusted returns. Despite their ability to influence performance for U.S. investors, currency movements historically have had low correlations with the local-currency-denominated price movements of foreign stocks.For example, during the 25-year period ending in December 2010, the foreign-exchange movement of major foreign currencies had only a 0.16 correlation with the local currency returns of foreign equities. This implies that the price changes of foreign stocks have had very little to no relationship with the movements in the exchange-rate value of the U.S. dollar.

Click to enlarge

us-dollar-foreign-correlation.png

Source: Foreign Stocks: Potential Benefits of Maintaining Currency Exposure, January 2011, Fidelity Investments

The impact of currency movements on foreign stocks returns can be significant. For example, in 2010 Australian stocks were roughly flat. But the Australian dollar strengthened against the US dollar. This boosted returns to US investors in Australian stocks leading to a 14.4% gain after the local returns were exchanged into US dollars. On the other hand German stocks rose 16.9% in local currency terms. But due to the weakening of the Euro this resulted a lowering of the returns to just 9.3% in dollar terms to US investors. These examples show that in the short-term currency movements have a strong impact on foreign stock returns.  However in the long-term (past 25 years) U.S. stocks have had a modestly negative correlation (-0.19) against foreign-exchange movements.

foreign-stock-returns.png

Hence currency movements can help lower correlations between U.S. stocks and foreign stocks. In the past 25 years foreign stocks had a correlation of 0.75 to US stocks in local currency terms.But when the impact of currency movements is incorporated and returns calculated in US dollars, the correlation was reduced to 0.69. The same effect can be seen for other periods such as 15, 20, 35 years as well.

Predicting currency movements is extremely difficult for ordinary investors. In the short-term, they have a big impact on the stock returns for US investors. In the long-term though, the low-correlations between currency movements and stock prices actually helps investors to achieve portfolio diversification benefits, such as lower portfolio volatility and higher risk-adjusted returns.

Asia’s Top 50 Companies

Each year Forbes Asia publishes the best big companies in Asia under the title “Asia’s Fab 50”. The rankings are based on earnings, revenues and stock prices. For 1010, the magazine evaluated 936 Asian companies that had revenues or market capitalization of at least US $ 3.0 billion.

The table below lists the top 50 Asian public companies:

[TABLE=1006]

Source: Forbes Asia

The emerging markets of India and China have the largest representation in this list with 16 companies each.The tremendous growth of these economies in the past few years is incredible. When the ranking was first released in 2005, just 5 Chinese and 3 Indian companies made it to the list. For the second year in a row there were no companies represented by Philippines and Malaysia.

Disclosure: No positions

Comparison of Economies: China vs. USA

China is one of the largest trading partner of the U.S. China’s global influence is growing and is projected to become a super-power in the future while the U.S. economic power declines. As the countries follow different political and economic systems, I wanted to compare some of the differences between these two large economies.

The table below compares select economic factors between China and the U.S.:

[TABLE=952]

Note: Some of the data shown may not be the latest. I have used them exactly as it is in the CIA site.

Source: The World Factbook, CIA

At just over $5 Trillion, the economy of China is less than half the size of the American economy.Despite having a huge population, the unemployment rate is lower in China than in the US. This is not surprising since China employs millions of workers in the manufacturing sector due to lower wages.

Unlike China, the U.S. spends more than 50% above its annual revenues leading to high deficits. Hence the public debt as a percentage of GDP is higher for the U.S. relative to China and the current account balance is negative as well. In addition the external debt owed by China is just$406 billion compared to a staggering $14 Trillion by the U.S. The auto market in China is growing faster than in the U.S. However since the total number of cars on the road is much lesser than the U.S. China’s oil consumption is lower relative to the U.S. With soaring auto sales China’s oil consumption is projected to rise further.

Should The U.S. Dump The Dollar And Join The Euro?

The Euro is the common currency of most of the European countries. Similar to the Euro, some have suggested that North America should have its own common currency and get rid of the individual currencies. So instead of the Canadian dollar, the US dollar and the Mexican Peso a common yet-to-named currency can become the official currency of three countries. Obviously this idea has not become a reality until now due to vast differences including cultural, political and economic differences between these countries.

I came across a radical proposal put forward by Bill Bonner, Best-selling investment author in Australia  and owner of both Fleet Street Publications and MoneyWeek magazine (UK).

From the article:

Switch to the euro! The US should abandon the dollar and take up the euro as its currency.

Sounds crazy? Un-American? But think of the advantages.

First, the euro is more colorful. It’s more fun to look at and use.

Second, the euro is worth more than the dollar; you don’t have to carry around so much currency.

Third, when you travel to Europe, you won’t have to convert your money.

Fourth, Europe is the world’s largest economic unit. Having a currency in common with it will make it easier for the US to trade.

Fifth, the Fed doesn’t control the value of the euro. Instead, it is controlled by European bankers who, generally, are made of sterner stuff than Bernanke et al.

Sixth, European bankers will not readily print euros just to help the US continue its program of reckless spending.

Seventh, unable to fiddle its own currency, and inflate away its debts, the US will have to cut spending.

Eighth, the whiners, chiselers and something-for-nothing crowd in the US can moan all they want; Jean Claude Trichet won’t give a damn.

Source: Via MoneyWeek