Ordinary Investors Should Not Try To Time The Markets

Equity markets fall and rise for a multitude of reasons that no one can predict. So investors should not try to time the market moves. This is especially important for ordinary investors. Sophisticated professional investors such as hedge funds and other traders are able to reap fantastic profits from taking advantage of volatility in the markets but even some of the fail when the strategy backfires.

Click to enlarge
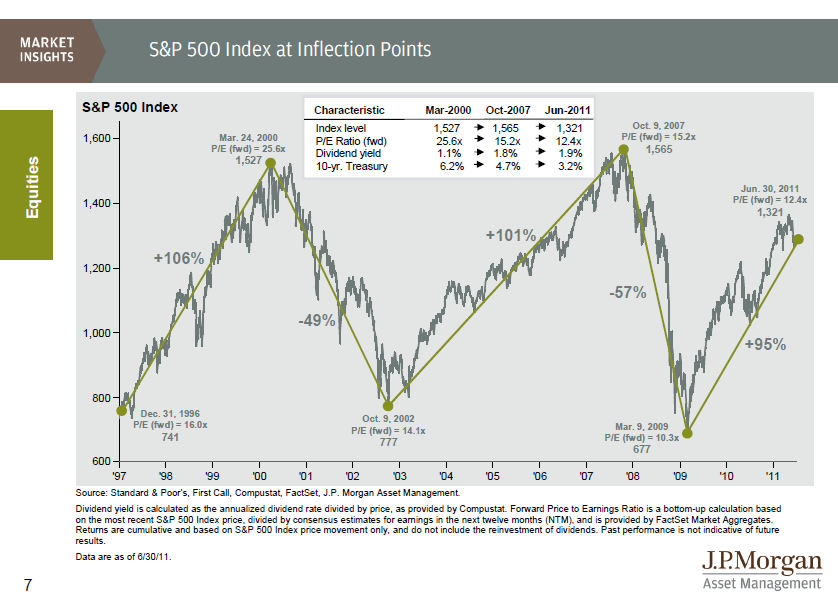
Source:  JPMorgan Funds via The Big Picture

To take advantage of the market gains, one is better off staying fully invested as opposed to repeated buying and selling. As no one can predict the movement of equity markets, even missing out a few days can lower one’s return substantially as shown in the graphic below. However it should also be noted that even staying fully invested does not guarantee a profit.
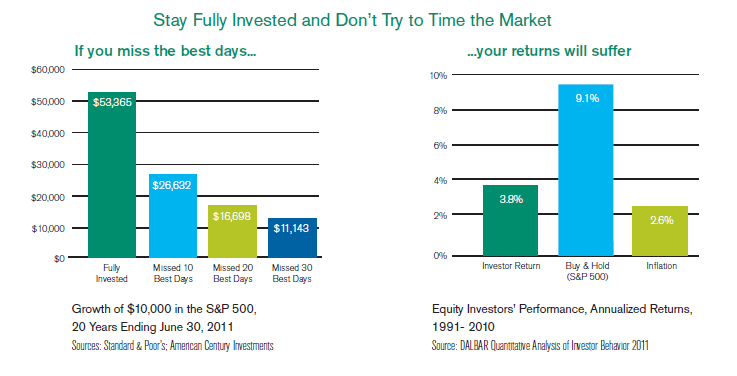
Source: Time-Tested Investment Strategies for the Long Term, American Century Investments

Related ETF:

SPDR S&P 500 ETF (SPY)

Disclosure: No Positions
U.S. Household Debt: A Major Impediment To Any Economic Recovery

The size of the U.S. economy is about $14.66 Trillion. However over 70% of the GDP is based on consumption spending. As a result any recovery is highly dependent on the U.S. consumer whose household debt is still too high by historical standards. This is in sharp contrast to U.S. companies which hold over $1.0 Trillion in cash and cash equivalents on their balance sheets. With the official unemployment rate at 9.1% in August, millions of unemployed Americans are unable to contribute much to an economic recovery due to reduced spending.

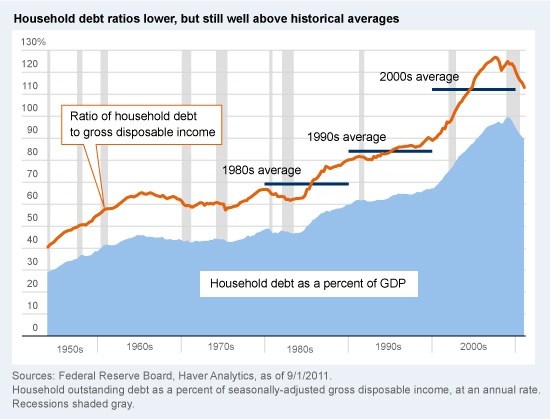
According to a Federal Reserve Bank study, the U.S. ratio of household debt-to-disposable income was 147.2% during the third quarter of 2010. This is still higher than historical averages as shown in the following graph:

Source: The albatross on economic growth, Fidelity Investments

From the research article:

After peaking at $13.9 trillion in the first quarter of 2008, overall household debt has fallen by $608 billion—but what really matters is household debt relative to personal income. Measuring debt levels relative to a person’s income gives a better indication of the capacity to spend. Using the ratio of total household debt to gross disposable income, it is striking how quickly the average household piled on debt in the 2000s.7

From 1952 to 1979, the average ratio of household debt to gross disposable income was 57%, but over the past three decades the averages steadily, and then dramatically, climbed higher. In the 1980s, it averaged 69%; in the 1990s it averaged 84%; but then the housing boom hit in the 2000s and the ratio skyrocketed to an average of 112%. The ratio ultimately peaked in Q3 2007 at 127%, right before the onset of the recession.8

While the household-debt-to-disposable-income ratio has come down to 113%, there is still a way to go to reach the lower levels of the 1980s or ’90s. Given the level of gross disposable income at the end of Q1, overall household debt would need to fall another $3.4 trillion to match the average debt-to-disposable-income ratio of 84% from the 1990s.

It will be a long slog to get household debt back to more sustainable levels—a process made all the more difficult and painful by the slow growth in personal income. As long as household debt levels remain high, deflationary pressures will likely remain a headwind to consumer spending, and thus to economic growth.

Most Energy ADRs Are Down YTD

Most of the oil and natural gas producers and related players in the energy sector are down year-to-date. In addition to the weakness of economies around the world, the fall in crude oil prices have contributed to this poor performance.

The table below lists all the exchange-traded energy ADRs together with their YTD returns:

[TABLE=1040]


Source: Bank of New York Mellon

Disclosure: Long PBR, EC


15 European Utilities Look Attractive For Income Investors

Many European markets are down 20% or more so far this year. Some investors are avoiding European stocks entirely. However they may be missing out on some excellent opportunities. Among the various sectors, the utility sector looks attractive for income investors at the current levels.

The STOXX TMI Utilities Index which is comprised of 34 utilities from across Europe is down 27% YTD in US Dollar terms. The index is down over 50% in the past 3 years alone.

The STOXX TMI Utilities Index 5-year performance:

Click to enlarge

Source: STOXX

As European utilities traditionally follow conservative business models and have high dividend payouts, the current stock prices of some of these utilities offer good entry points. To get started, I have listed the 15 utilities below with their current dividend yields and YTD returns:

1.Company: Centrica (CPYYY)
Current Dividend Yield: 5.03%
YTD Change: -8.43%
Country: UK

2.Company:E.ON (EONGY)
Current Dividend Yield: 10.89%
YTD Change: -34.89%
Country: Germany

3.Company: Energias de Portugal (EDPFY)
Current Dividend Yield: 7.42%
YTD Change: -1.89%
Country:Portugal

4.Company: EVN (EVNVY)
Current Dividend Yield: 4.02%
YTD Change: -5.67%
Country:Austria

5.Company: Iberdrola (IBDRY)
Current Dividend Yield: 1.22%
YTD Change: -12.46%
Country:Spain

6.Company: International Power (IPRPY)
Current Dividend Yield: 2.82%
YTD Change: -24.26%
Country: UK

7.Company: National Grid (NGG)
Current Dividend Yield: 5.74%
YTD Change: 13.93%
Country: UK

8.Company: RWE (RWEOY)
Current Dividend Yield: 15.37%
YTD Change: -49.72%
Country: Germany

9.Company: Scottish & Southern Energy (SSEZY)
Current Dividend Yield: 5.39%
YTD Change: 5.95%
Country: UK

10.Company:United Utilities (UUGRY)
Current Dividend Yield: 5.07%
YTD Change: 3.15%
Country: UK

11.Company: Veolia Environnement (VE)
Current Dividend Yield: 11.27%
YTD Change: -48.00%
Country: France

12.Company:Verbund (OEZVY)
Current Dividend Yield: 2.34%
YTD Change: -7.81%
Country: Austria

13.Company: Electricite de France (ECIFY)
Current Dividend Yield: 5.64%
YTD Change: – 32.17%
Country: France

14.Company: Enel  (ENLAY)
Current Dividend Yield: 8.58%
YTD Change: -9.88%
Country: Italy

15.Company: Suez Environnement (SZEVY)
Current Dividend Yield: 5.80%
YTD Change: -24.12%
Country: France

Disclosure: Long EONGY, VE and RWEOY

Comparing Childcare Expenditures Across OECD Countries

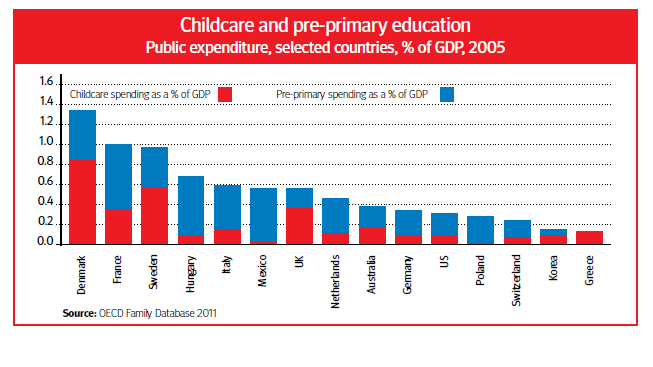
The following chart shows public childcare and pre-primary education expenditure across a select few OECD countries:

Click to enlarge

Public spending on childcare in France, Sweden and the U.K. is in the 0.4% to 0.6% of the GDP which is double that spent by Greece and Korea. The U.S. spends relatively low on childcare than most European countries noted above.

The number of paid maternity leave for certain countries are:

France – 16.0 weeks
Sweden – 8.5 weeks
Greece – Over 43 weeks
UK -52 weeks
Ireland – 42 weeks
USA – No paid time-off for new mothers

According to a 2007 study by McGill University’s Institute for Health and Social Policy, the US is one of the five countries in the world that does not guarantee any paid leave for new mothers. The other four countries are the third-world countries of Lesotho, Liberia, Swaziland, and Papua New Guinea.

While most countries have paid paid sick days for short and long-term illnesses, under the Family and Medical Leave Act(FMLA) of 1993, U.S. workers are allowed to take up to 12 weeks leave for to tend to family or medical needs, but their absence is considered as unpaid leave.

The study also found that 137 countries require its employers to provide paid annual leave, whereas the Unites States does not guarantee any sort of paid leave.

Source: OECD Observer, 2Q, 2011