Most Energy ADRs Are Down YTD

Most of the oil and natural gas producers and related players in the energy sector are down year-to-date. In addition to the weakness of economies around the world, the fall in crude oil prices have contributed to this poor performance.

The table below lists all the exchange-traded energy ADRs together with their YTD returns:

[TABLE=1040]


Source: Bank of New York Mellon

Disclosure: Long PBR, EC
 

15 European Utilities Look Attractive For Income Investors

Many European markets are down 20% or more so far this year. Some investors are avoiding European stocks entirely. However they may be missing out on some excellent opportunities. Among the various sectors, the utility sector looks attractive for income investors at the current levels.

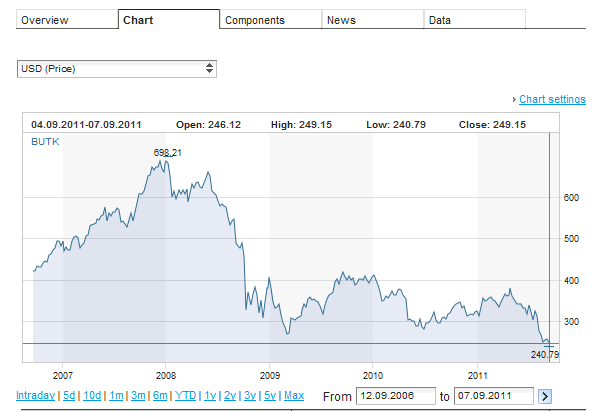
The STOXX TMI Utilities Index which is comprised of 34 utilities from across Europe is down 27% YTD in US Dollar terms. The index is down over 50% in the past 3 years alone.

The STOXX TMI Utilities Index 5-year performance:

Click to enlarge

Source: STOXX

As European utilities traditionally follow conservative business models and have high dividend payouts, the current stock prices of some of these utilities offer good entry points. To get started, I have listed the 15 utilities below with their current dividend yields and YTD returns:

1.Company: Centrica (CPYYY)
Current Dividend Yield: 5.03%
YTD Change: -8.43%
Country: UK

2.Company:E.ON (EONGY)
Current Dividend Yield: 10.89%
YTD Change: -34.89%
Country: Germany

3.Company: Energias de Portugal (EDPFY)
Current Dividend Yield: 7.42%
YTD Change: -1.89%
Country:Portugal

4.Company: EVN (EVNVY)
Current Dividend Yield: 4.02%
YTD Change: -5.67%
Country:Austria

5.Company: Iberdrola (IBDRY)
Current Dividend Yield: 1.22%
YTD Change: -12.46%
Country:Spain

6.Company: International Power (IPRPY)
Current Dividend Yield: 2.82%
YTD Change: -24.26%
Country: UK

7.Company: National Grid (NGG)
Current Dividend Yield: 5.74%
YTD Change: 13.93%
Country: UK

8.Company: RWE (RWEOY)
Current Dividend Yield: 15.37%
YTD Change: -49.72%
Country: Germany

9.Company: Scottish & Southern Energy (SSEZY)
Current Dividend Yield: 5.39%
YTD Change: 5.95%
Country: UK

10.Company:United Utilities (UUGRY)
Current Dividend Yield: 5.07%
YTD Change: 3.15%
Country: UK

11.Company: Veolia Environnement (VE)
Current Dividend Yield: 11.27%
YTD Change: -48.00%
Country: France

12.Company:Verbund (OEZVY)
Current Dividend Yield: 2.34%
YTD Change: -7.81%
Country: Austria

13.Company: Electricite de France (ECIFY)
Current Dividend Yield: 5.64%
YTD Change: – 32.17%
Country: France

14.Company: Enel  (ENLAY)
Current Dividend Yield: 8.58%
YTD Change: -9.88%
Country: Italy

15.Company: Suez Environnement (SZEVY)
Current Dividend Yield: 5.80%
YTD Change: -24.12%
Country: France

Disclosure: Long EONGY, VE and RWEOY

Comparing Childcare Expenditures Across OECD Countries

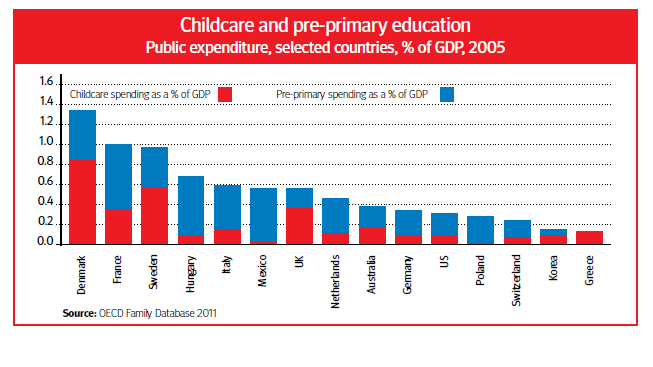
The following chart shows public childcare and pre-primary education expenditure across a select few OECD countries:

Click to enlarge

Public spending on childcare in France, Sweden and the U.K. is in the 0.4% to 0.6% of the GDP which is double that spent by Greece and Korea. The U.S. spends relatively low on childcare than most European countries noted above.

The number of paid maternity leave for certain countries are:

France – 16.0 weeks
Sweden – 8.5 weeks
Greece – Over 43 weeks
UK -52 weeks
Ireland – 42 weeks
USA – No paid time-off for new mothers

According to a 2007 study by McGill University’s Institute for Health and Social Policy, the US is one of the five countries in the world that does not guarantee any paid leave for new mothers. The other four countries are the third-world countries of Lesotho, Liberia, Swaziland, and Papua New Guinea.

While most countries have paid paid sick days for short and long-term illnesses, under the Family and Medical Leave Act(FMLA) of 1993, U.S. workers are allowed to take up to 12 weeks leave for to tend to family or medical needs, but their absence is considered as unpaid leave.

The study also found that 137 countries require its employers to provide paid annual leave, whereas the Unites States does not guarantee any sort of paid leave.

Source: OECD Observer, 2Q, 2011

Five Undervalued Foreign Stocks

A low Price-to-Book(P/B) ratio implies that the stock may be undervalued. This ratio can be used together with other factors in identifying potential investment opportunities. The following five foreign stocks have P/B ratios of ≤ 0.75:

1.Company: Banco Santander SA (SAN)
Current Dividend Yield:  9.98%
Sector: Banking
Country: Spain

2.Company: Brasil Telecom SA (BTM)
Current Dividend Yield: 9.14%
Sector: Telecom
Country:Brazil

3.Company: ArcelorMittal (MT)
Current Dividend Yield: 3.76%
Sector:Iron & Steel
Country:Luxembourg

4.Company: Petrobras Argentina SA (PZE)
Current Dividend Yield: 2.65%
Sector:Oil & Gas – Integrated
Country: Argentina

5.Company: Edenor S.A (EDN)
Current Dividend Yield: N/A
Sector:Electric Utilities
Country: Argentina

Disclosure: Long STD

U.S. Economic Crises Since 1990

The following is an excerpt of the U.S. economy from the CIA’s The World Factbook site:

The US has the largest and most technologically powerful economy in the world, with a per capita GDP of $47,200. In this market-oriented economy, private individuals and business firms make most of the decisions, and the federal and state governments buy needed goods and services predominantly in the private marketplace. US business firms enjoy greater flexibility than their counterparts in Western Europe and Japan in decisions to expand capital plant, to lay off surplus workers, and to develop new products.

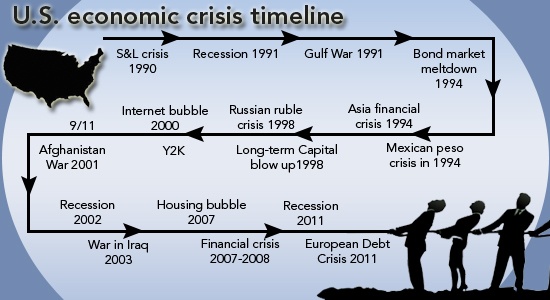
While the U.S. has the largest economy in the world, it is also vulnerable to economic crises of all forms and sizes. Due to structural and political setup, the U.S. economy follows a boom and bust cycle with expansion and contraction occurring every few years or so. Accordingly fortunes are made and lost.

The following graphic illustrates my point with all the major events faced by the U.S. economy since 1990:

Click to enlarge

Source: Time to reconsider stocks, Fidelity Viewpoints

Dr. Claus te Wildt, the author of the above report notes that the Dow Jones Industrials Average(DJIA) more than quadrupled from about 2,500 in September of 1990 to over 12,000 in February of this year. He says this performance shows the power of equities and the strength of the U.S. economy.

However he ignores to mention certain important facts in his report such as comparing the DJIA performance in shorter periods.The DJIA reached 10,000 for the first time in March 1999. At the start of 2000, it stood at 11,501.By the end of December,2010 it stood at just 11,577 which implies that the index basically went nowhere in a decade.Furthermore last Friday it closed at 11,240 which is lower than the 11,501 at the beginning of 2000. So we can conclude that a high number of economic crises in short time periods such as two decades adversely affects the performance of equities.