The Role of US and UK Central Banks in Creating Housing Bubbles and Rising Income Inequality

The US and UK Central Banks were complicit in inflating the housing bubble by keeping the interest rates too low for a long time. While this theory has been discussed by many, Albert Edwards of Société Générale takes a different angle on why the Central Bankers kept encouraging the housing bubble.

A post in FT Alphaville quotes Albert with his following argument:

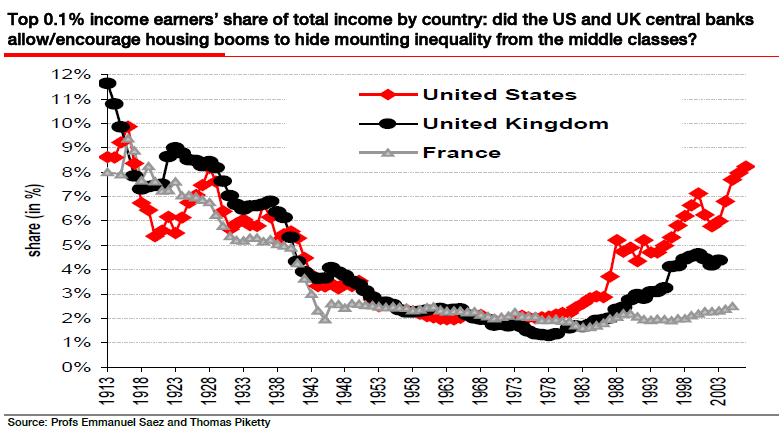
The US and UK have seen a huge rise in inequality over the last two decades, as growth in national income has been diverted almost exclusively to the top income earners (see chart below). The middle classes have seen median real incomes stagnate over that period and, as a consequence, corporate margins and profits have boomed.

Some recent reading has got me thinking as to whether the US and UK central banks were actively complicit in an aggressive re-distributive policy benefiting the very rich. Indeed, it has been amazing how little political backlash there has been against the stagnation of ordinary people’s earnings in the US and UK. Did central banks, in creating housing bubbles, help distract middle class attention from this re-distributive policy by allowing them to keep consuming via equity extraction?

Click to enlarge


Source: FT Alphaville

I believe that the central bankers did not help encourage the housing bubble to divert attention from the growing inequality. However they failed to perform their duties leading the financial system to almost collapse a couple of years ago.
A Review of the Invesco Perpetual High Income Fund

The Invesco Perpetual High Income Fund is one of the largest unit trusts (or mutual fund) in UK with an asset base of about £11.0 billion . The fund aims to achieve a level of high income together with capital growth. The fund invests most of the assets in UK-listed companies with the remaining in other countries. Veteran fund manager Mr.Neil Woodford has run the fund since its inception in October 1988 and the S&P Fund Management Rating is ‘AAA’. The dividend yield of the fund is 3.90% based on the local currency.

Unlike other mutual funds, Invesco Perpetual High Income Fund is light on financials with just over 6% of the portfolio allocated to this sector. About 69% of the fund’s assets are invested in health care, consumer goods and industrials.

Investors looking to add equities for income can consider some of the holdings held by the fund. The top 10 holdings of the fund are listed below with their US market tickers and dividend yields:

1.Company: AstraZeneca PLC (AZN)
Current Dividend Yield: 6.00%
Sector: Biotechnology & Drugs

2.Company: GlaxoSmithKline PLC (GSK)
Current Dividend Yield: 5.10%
Sector:Major Drugs

3.Company: Reynolds American Inc (RAI)
Current Dividend Yield: 5.58%
Sector: Tobacco

4.Company: British American Tobacco PLC (BTI)
Current Dividend Yield: 4.20%
Sector: Tobacco

5.Company: BG Group PLC (OTC:BRGYY)
Current Dividend Yield: 1.09%
Sector: Oil & Gas Operations

6.Company:Vodafone Group PLC (VOD)
Current Dividend Yield: 5.46%
Sector: Telecom

7.Company: Roche Holding AG (OTC:RHHBY)
Current Dividend Yield: 4.58%
Sector: Major Drugs

8.Company: BT Group PLC (BT)
Current Dividend Yield: 4.14%
Sector: Telecom

9.Company: Imperial Tobacco Group PLC (OTC:ITYBY)
Current Dividend Yield: 4.31%
Sector: Tobacco

10.Company: Reckitt Benckiser Group PLC (OTC:RBGPY)
Current Dividend Yield: 3.82%
Sector:Personal & Household Products

Note: Dividend yields noted are as of Nov 18th, 2011

Disclosure: No Positions

Which Countries Have the Highest Subsidies for Fossil Fuels?

Most developing and resource-rich countries offer high subsidies for fossil-fuel consumption. Subsidies for oil, natural gas, electricity and coal vary among countries depending on the natural resources present in the respective country in addition to other factors.

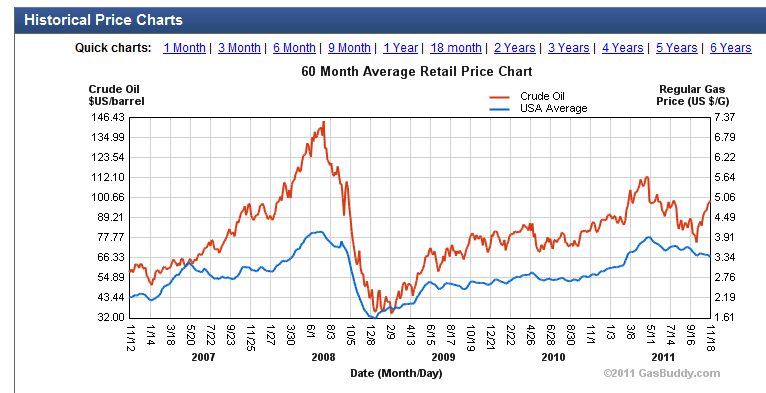
In the developed world, subsidies for oil is mostly non-existent despite some of the countries blessed with large reserves of oil. For example, the U.S. produces millions of gallons from places like Alaska, Texas, etc. and offshore fields. However the price of gasoline at the pump is not subsidized by the state and is determined by the market. Hence gas prices vary widely on a daily basis. The following chart shows the U.S. retail gas prices and the price of crude oil for the past five years:

Click to enlarge

Source: www.gasbuddy.com

The average retail price plunged to the lowest in the end of 2008 at the height of the credit crisis but has recovered to reach well above $3.00 per gallon now. For the most part, gas prices track the global crude oil prices.

Compared to the market-based pricing in the developed countries, emerging and oil-rich countries offer heavy subsidies for consumption of fossil-fuels primarily to simulate economic growth, alleviate poverty, etc.

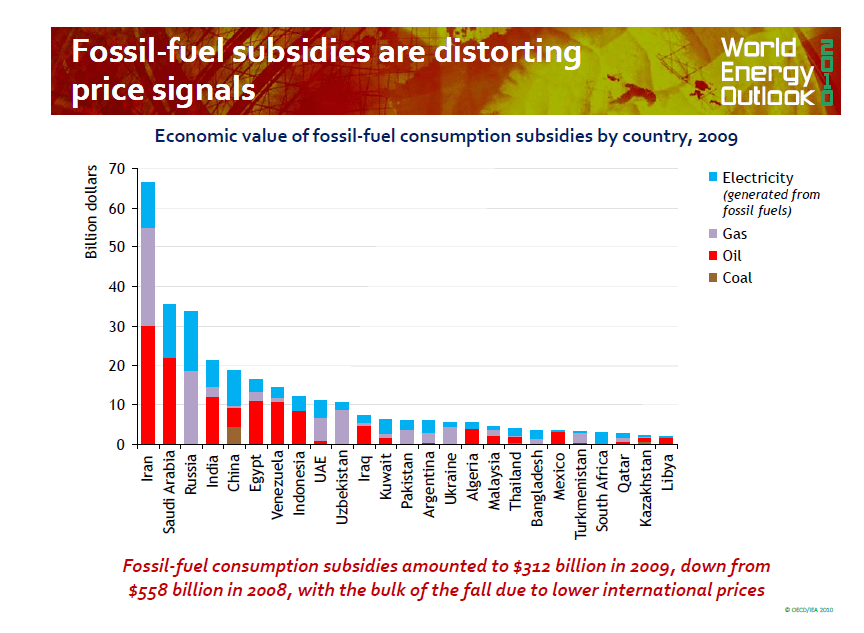
The following chart shows the subsidies offered by select countries for different types of fossil fuel consumption:

Source: World Energy Outlook 2010, IEA

Oil-rich countries such as Saudi Arabia, Iran, Iraq, Malaysia, Venezuela, Mexico, etc. have high subsidies for oil consumption.

Related ETFs:

The United States Oil Fund (USO)
United States Gasoline Fund (UGA)
PowerShares DB Energy Fund (DBE)

Disclosure: No Positions

The Global Wealth Pyramid

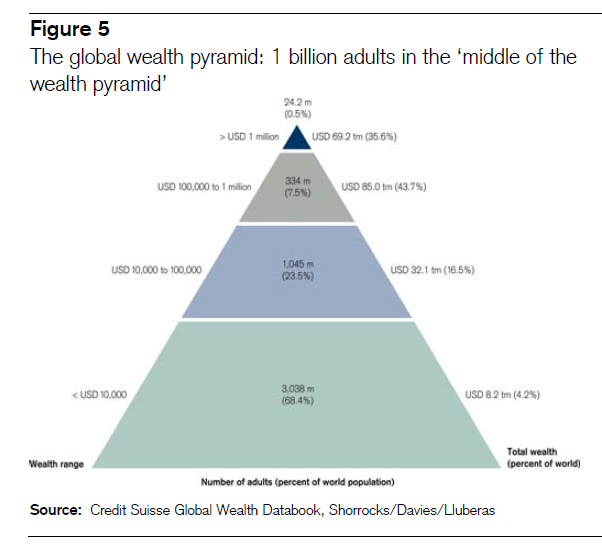
The world population crossed the 7 billion mark this year. The majority of this population lives in the developing world. According to The Global Wealth Report published last by Credit Suisse last year, about 92% of the world’s population can be classified as part of the middle, the upper middle and the lower classes. The 334 million in the upper middle class presents a large group for significant earnings growth potential for the banking industry. The Occupy protest movement in the US and other the developed countries is a manifestation of the class struggle between those at the bottom of the pyramid (the 99%) vs. those at the top of the pyramid (1%).

The Global Wealth Pyramid

Click to enlarge


Source: The Global Wealth Report, The Credit Suisse Research Institute

U.S. Stock Market Volatility Since 1928

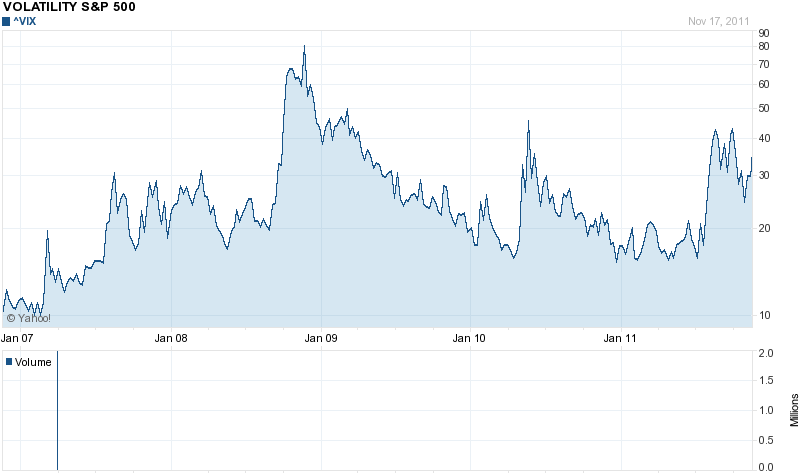
Volatility in the U.S. stock market has been extreme in the past few years. The following chart shows the 5-year chart for the VIX index:

Click to enlarge

Source: Yahoo Finance

After peaking in late 2008, the fear index started to moderate until the middle of this year after which it has spiked again due to the European debt crisis and other factors.

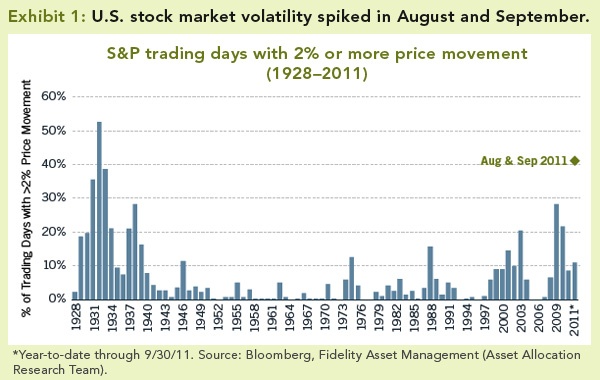
A research report by Fidelity notes that more recently markets are driven mostly by macro issues. The following chart shows the volatility in the S&P 500 since 1928:


Source: Macro-driven markets: What asset prices are signaling, Fidelity Investments

From the Fidelity report:

In August and September, asset prices fluctuated wildly: Over 40% of the trading days in the U.S. stock market experienced either up- or downswings of more than 2%—a degree of instability similar to the 1930s (see Exhibit 1, below). This volatility could be attributed to a limited number of factors, implying that investors were reacting to the same small set of phenomena. It was driven primarily by macro uncertainties, in particular, the eurozone financial turmoil and the U.S. government debt ceiling debate. The volatility was further exacerbated by the dominance of short-term and index-oriented trading—including high frequency trading, program trading, and ETFs—that triggered sharp moves among broad baskets of securities.

High volatility in the markets is not beneficial to long-term investors but is a boon to short-term traders. Strong fluctuations in equity prices also confirm investors’ lack of confidence in holding equities for the long-term.

Related ETF:

SPDR S&P 500 ETF (SPY)

Disclosure: No Positions