Single Country Index Returns: Developed and Emerging Markets 2002 – 2011

Each year iShares releases the updated Single Country Index Returns chart. The latest version of this chart for Developed Markets from 2002 to 2011 is shown below:

Click to enlarge in pdf format
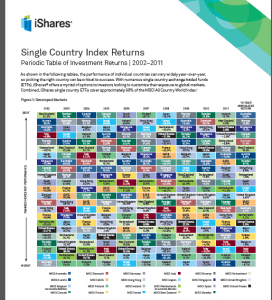
A few observations:

  • Australia, Norway, Singapore and Canada have the highest 10-year annualized returns of over 11.0%.
  • The 10-year annualized returns for the U.S. is of over 3.0%.
  • Except 2008 and 2011, Canada performed better than the U.S. every year.


The chart for Emerging Markets from 2002 to 2011 is shown below:

Click to enlarge in pdf format
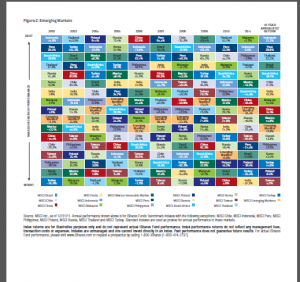
A few observations:

  • The frontier market of Peru was one of the best performing markets for most of the years with double digit returns and had the second highest 10-year annualized returns of about 30.0%.
  • While the U.S. had a 10-year annualized returns over 3.0% neighboring Mexico returned about 15.0%.
  • The high risk of investing emerging markets was confirmed during the financial crisis of 2008 when each of the BRIC countries fell over 50% with Russia crashing by about 74%.

Source: iShares

Related article:

Single Country Index Returns: Developed and Emerging Markets 2001 – 2010

Single Country Index Returns: Developed and Emerging Markets 2004 – 2013

Some related ETFs:

iShares MSCI Canada Index (EWC)
iShares MSCI Australia Index (EWA)
iShares MSCI Germany Index Fund (EWG)
iShares MSCI Singapore Index Fund (EWS)
SPDR S&P 500 ETF (SPY)

Disclosure: No Positions

Performance Review: Goodyear Tire & Rubber Company vs. Foreign Tire Makers

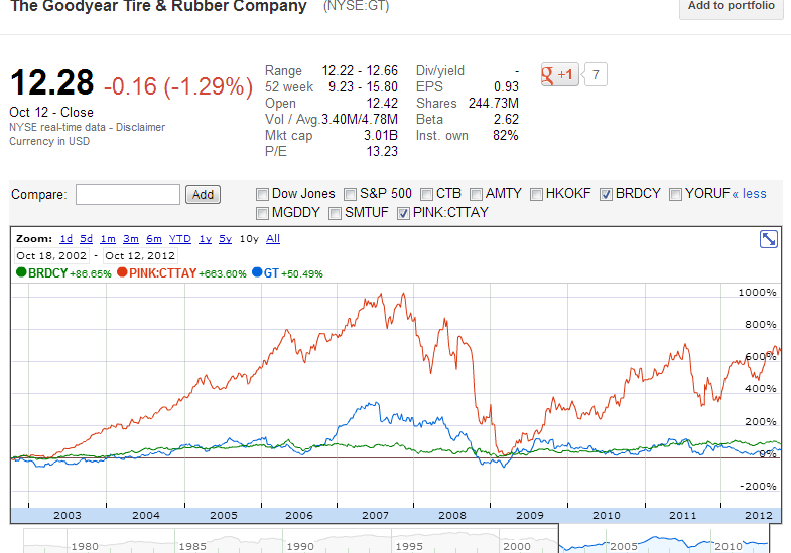
The follow charts show the performance of US-based Goodyear Tire & Rubber Company (GT) against select foreign tire makers – Germany’s  Continental AG (CTTAY), Japan’s Bridgestone(BRDCY) and France’s Cie Generale des Etablissements Michelin (MGDDY):

5-Year returns comparison:

Click to enlarge


10-Year returns comparison:


Source: Google Finance

Disclosure: No Positions

15 Large-Cap Foreign Stocks Paying More Than 5% Dividends

I ran the stock screener to screen for foreign stocks with the following conditions:

  • Market Capitalization ≥ $50.0B
  • Dividend Yield ≥ 4.00%

This resultant 15 stocks are listed in the table below:

[TABLE=1143]

Of the 37 ADRs with a market cap of more $50.0 billion, China Mobile Ltd (CHL) takes the top spot with a market cap of $217.0 billion. It is interesting that Norway-based Statoil has a market cap of $82.0 billion compared to BP’s $136.0 billion.

Disclosure: Long PBR, SAN


Performance Review: General Mills vs. Nestle SA

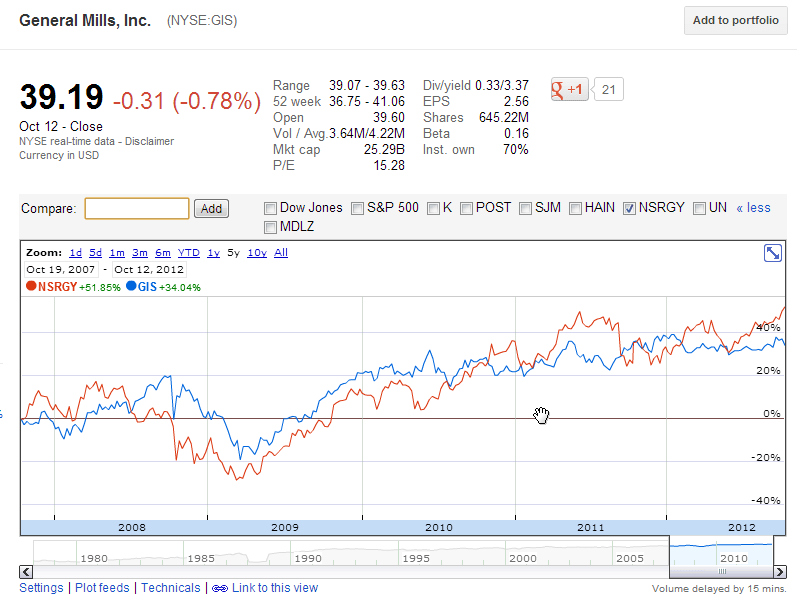
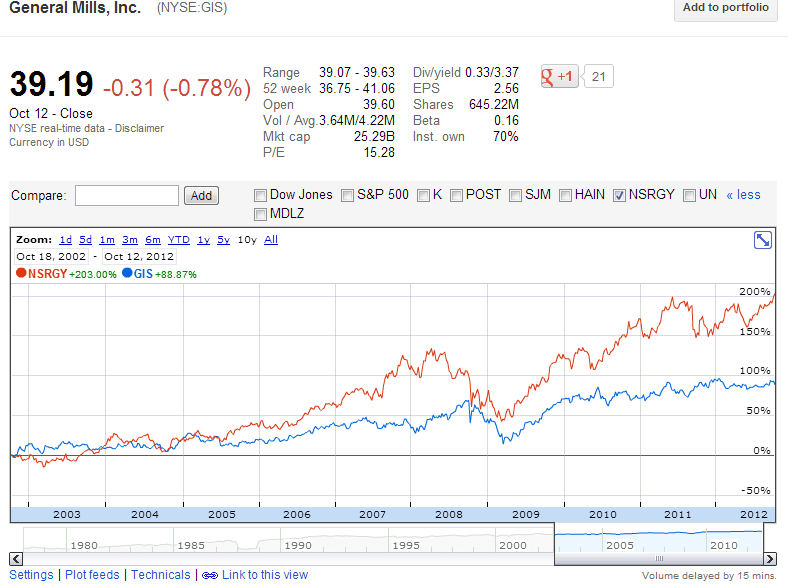
The following charts shows the performance comparison of US-based food giant General Mills (GIS) and Switzerland-based Nestle SA (NSRGY). In the 5-year period shown, the gap in returns between these companies is not large. However the 10-year return of Nestle more than double that of General Mills’ return. Compared to General Mills, Nestle owns many brands which are highly popular in emerging markets. In addition, Nestle is also known for coming up with successful innovative products.

5-year return of General Mills vs. Nestle SA:

Click to enlarge


10-year return of General Mills vs. Nestle SA:

Source: Google Finance

Disclosure: Long GIS

Performance Review: Bank of America vs. Royal Bank of Canada

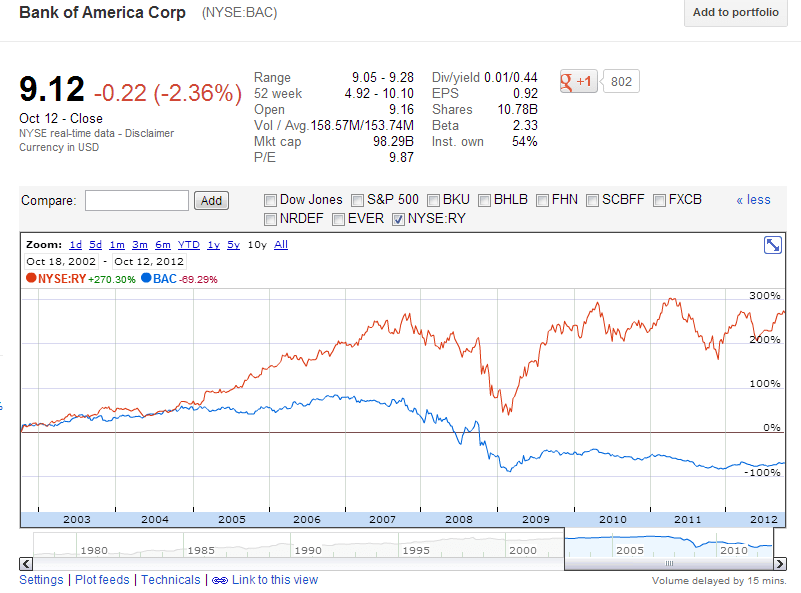
A quick look at the performance of Bank of America (BAC) and Royal Bank of Canada(RY) over 5 and 10 years shows the huge disparity in returns. The returns noted are based on share price changes only and do not include dividends.

5-year return of Bank of America and Royal Bank of Canada:

Click to enlarge


10-year return of Bank of America and Royal Bank of Canada:

Source: Google Finance

Disclosure: Long RY