The global pharmaceutical industry continues to grow and was up by an astonishing $1.4 Trillion in 2021. The Covid-19 pandemic gave a big boost to the industry. According to an article at ProClinical, the FDA approved 50 drugs in 2021 and M&A activity also picked up. With that brief intro, let’s take a look at the Top 10 Global Pharmaceutical firms in 2022 based on revenue so in 2021:
Click to enlarge
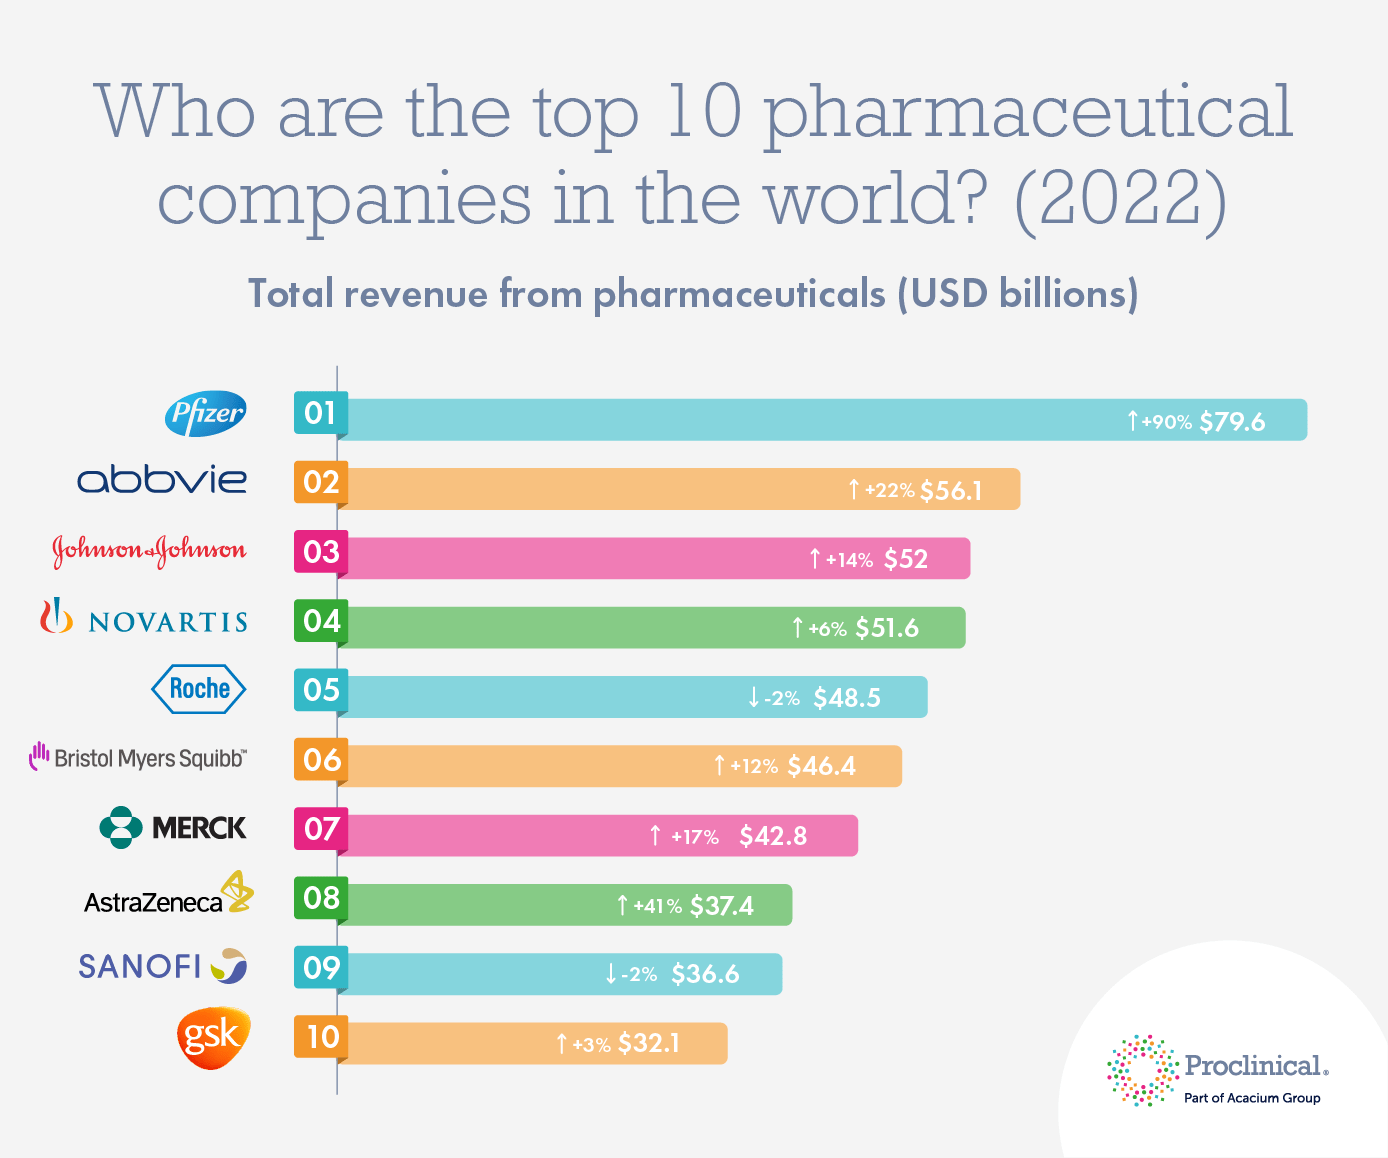
Source: Who are the top 10 pharmaceutical companies in the world? (2022), Proclinical
US pharma giant Pfizer was the top ranked firm in 2021 jumping from the sixth spot in previous year. Pfizer’s Covid-19 vaccine Comirnaty was a top contributor to its revenue with sales of over $37 billion. Pfizer was the first company to develop an effective vaccine for Covid-19 with its German partner BioNTech (BNTX). In December 2021, Pfizer received the FDA’s approval for its oral Covid-19 pill called Paxlovid.
AbbVie was the second top pharma company with sales of over $56 billion. One of the its best performing drug is Humira, the rheumatoid arthritis blockbuster.
The rest of the firms in the above list are the usual leaders. UK-based GlaxoSmithKline(GSK) came in at number 10 with sales of over $32 billion last year.
Referenced Companies:
- Pfizer(PFE)
- AbbVie Inc (ABBV)
- Johnson & Johnson (JNJ)
- Novartis AG (NVS)
- Roche Holding AG (RHHBY)
- Bristol-Myers Squibb Co (BMY)
- Merck & Co Inc (MRK)
- AstraZeneca (AZN)
- Sanofi (SNY)
- GlaxoSmithKline (GSK)
Disclosure: No positions