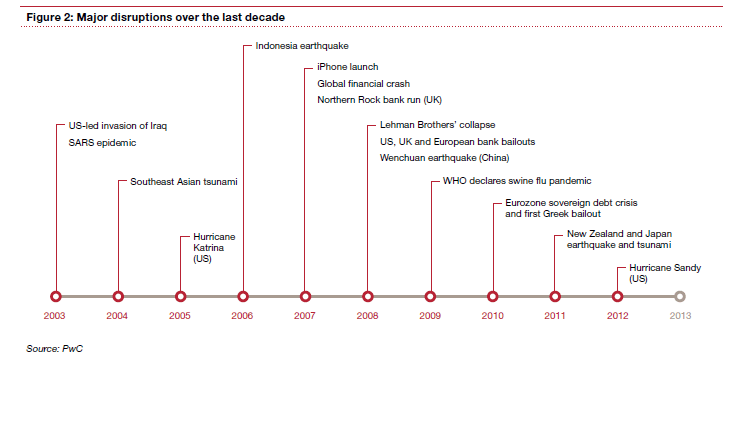
Here is a chart showing the major disruptions over the last decade, according to the PwC 16th Annual Global CEO Survey:
Click to enlarge
Source: PwC 16th Annual Global CEO Survey, PwC
Here is a chart showing the major disruptions over the last decade, according to the PwC 16th Annual Global CEO Survey:
Click to enlarge
Source: PwC 16th Annual Global CEO Survey, PwC
Every year Credit Suisse publishes the Global Investment Yearbook which contains a wealth of data on many markets. From the 2013 edition here are two charts related to the US markets.
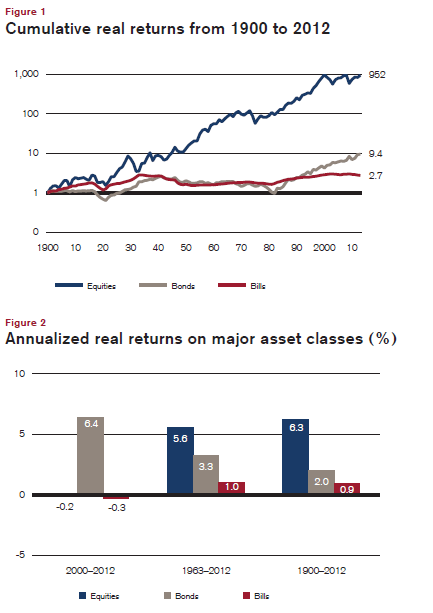
The Cumulative Real Returns from 1900 to 2012 & the Annualized Real Returns of Major Asset Classes(%):
Click to enlage
Source: Credit Suisse Global Investment Yearbook 2013, Credit Suisse
Since 1900 U.S. stocks have yielded a real return of 6.3% compared to just 2.0% for bonds. Stocks have out performed bonds strongly over very long periods.
From the report:
Figure 1 shows that, over the last 113 years, the real value of equities, with income reinvested, grew by a factor of 951.7 as compared to 9.4 for bonds and 2.7 for bills. Figure 2 displays the long-term real index levels as annualized returns, with equities giving 6.3%, bonds 2.0%, and bills 0.9% since 1900.
During the time period from 2000 to 2012 stocks had a negative return due to the global financial crisis and the dot-com implosion.
Consumer staples stocks traditionally have paid moderate dividends and offered slow and steady growth. Utility stocks on the other hand, have high dividend yields and are considered to have higher growth rates.
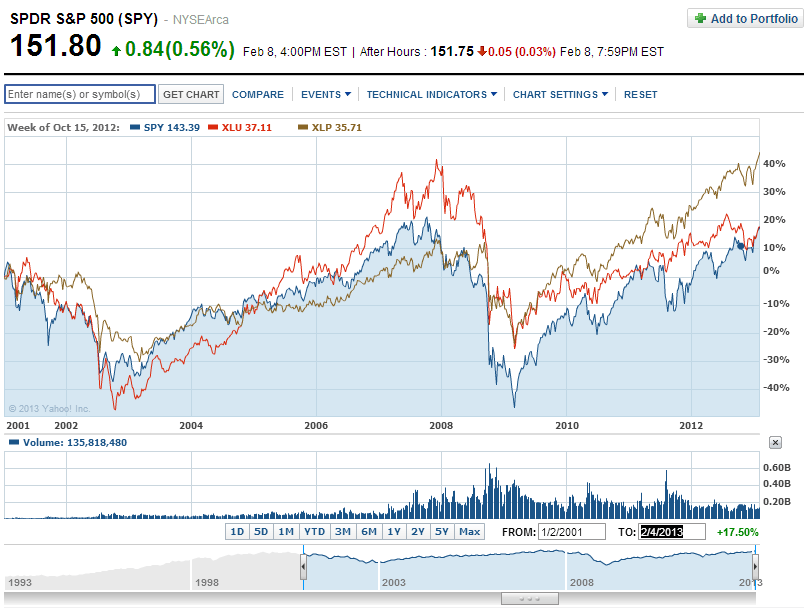
When it comes to choosing a sector for investment investors are faced with this question: Should I go with consumer staples which pay moderate dividends or should I go with utilities which pay high dividends?. In the long-term the low-dividend yield consumer staples have easily outperformed utilities. Though utilities have high dividends their dividend growth rate tend to be lower. Hence investors looking to invest for the long-term should invest some potion of their portfolio in consumer staple stocks.
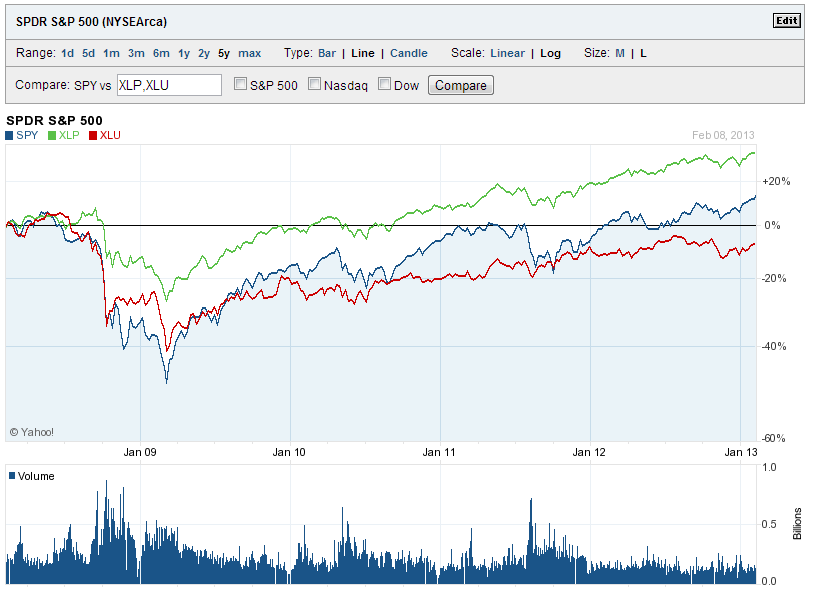
In order to confirm the above theory I used two ETFs for the sectors – Select Sector SPDR-Consumer Staples ETF (XLP) and Utilities Select Sector SPDR ETF (XLU) to measure against the S&P 500 ETF (SPY). In both the 5-year and long-term returns XLP outperformed XLU as shown in the charts below.
5-Year Return Comparison:
Click to enlarge
Long-Term Return Comparison:
Source: Yahoo Finance
According to Standard & Poor’s data, the 5-year annualized price return for consumer staples and utilities are 6.09% and -1.54%. The difference in returns is not surprising. In the 3-year and 1-year categories also consumer staples beat utilities.
Note: Chart data shown as of Feb 8, 2013
Disclosure: No Positions
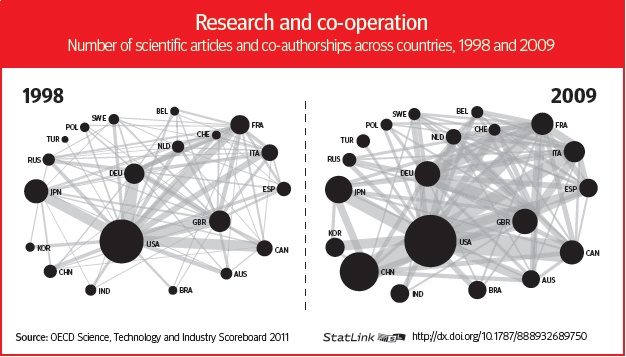
Scientific research and innovation was dominated by western countries up until a few years ago. The majority of the scientific publications in the world were published by researchers in these countries. However emerging countries are starting to compete fiercely in the field of scientific innovation. According to an article in OECD Observer, globalization and democratization of scientific research and innovation have especially lead Asian emerging countries to new global hubs of scientific research.
Click to enlarge
Source: Emerging innovators, OECD Observer
Only ten years ago China lagged in the field of scientific research.Today it has surpassed Germany and France to become number two in producing scientific publications in co-operating with partner countries such as Canada, USA and Japan. South Korea has also increased its R&D spending significantly in the past decade and today published more scientific research than Sweden, Russia and Turkey.
The U.S. still ranks the top country in research and innovation as in the above diagram. But China’s jump to number two position is surprising.
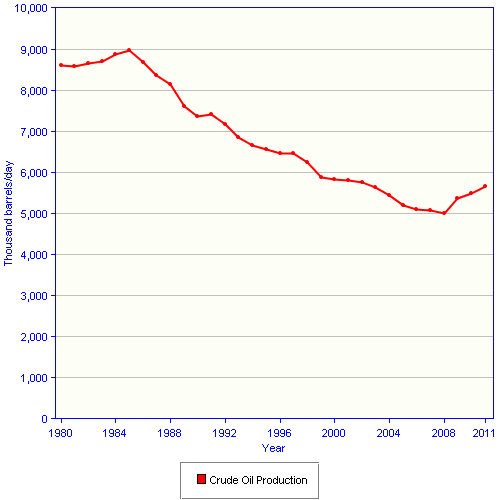
The U.S. is the world’d largest consumer of petroleum products primarily oil. Though the total population is about 330 million, every day millions of barrels of oil are used due to the high dependence on automobile for transportation. In fact, the country consumed 18.8 million barrels per day (MMbd) of petroleum products during 2011 according to the U.S. EIA.
Here is a graph showing the US consumption of petroleum products from 1980 thru 2011:
Click to enlarge
Source: US EIA
Oil consumption has declined since the peak of the global financial crisis as the economy slid into the great recession. Currently the US consumes about about 19 million barrels per day but produces only about 1/4th of that amount. Hence the rest of the oil is imported from other countries making the country highly dependent on foreign oil.
Related stocks:
The Complete List of Integrated Oil Companies Stocks Trading on the NYSE can be found here.