Correlation Between Tax Rates And Stock Returns

Effective January 1st of this year the rates on many different types of taxes increased as part of the fiscal cliff deal. However the most of these increases affect only high earners. The majority of the working population are not impacted by most these increases especially taxes related to investments such as capital gains and dividends. In anticipation of higher tax rates in 2013, many companies paid out special dividends or moved the dividend pay dates from first quarter 2013 to late 2012. These payouts primarily benefited insiders and big investors.

However were the actions of such companies justified? Should company highly-paid executives panic like pimple-faced high-school teenagers every time there is a possibility of a tax increase? Or put another way, is there a strong correlation between tax rates and equity returns?

Research shows that the correlation between tax rates and stock returns is very low. While in the short-term there may be a strong correlation, the correlation is pretty much insignificant  in the long-term.

From a research report by T.Rowe Price:

While some analysts warn that equity prices, and particularly relatively riskier assets such as small-cap stocks, may be pressured by the boost in the capital gains rate, T. Rowe Price managers say that the past three decades of market history suggest that tax rate changes have had relatively modest effects on equity valua­tions and dividend policies.

Moreover, investors are encouraged not to focus on any short-term effects as markets adjust over time. In the long run, stock prices are more driven by such fundamental factors as earnings, interest rates, and economic growth than tax changes.

Sudhir Nanda, head of T. Rowe Price’s quantitative equity research, says that since 1980 there have been eight changes in the top tax rate on dividends (including the pre-2003 changes when dividends were taxed at the same rate as ordinary income) and four changes to the top long-term capital gains rate. The overall impact of these changes on equity returns and valuations appears to have been modest.

Click to enlarge

Tax-rates-and-Stock-Returns

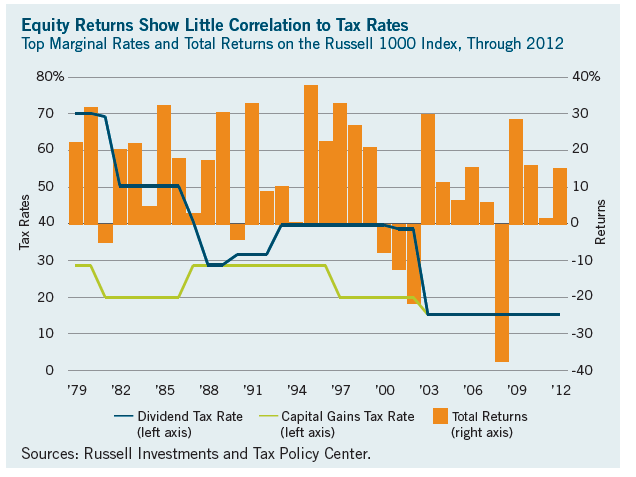
In fact, the S&P 500 soared 27.7% in the 12 months following the 1990 increase in the maximum dividend tax rate (from 28% to 31%), and it gained 5.3% in the 12 months after the 1993 dividend hike (from 31.0% to 39.6%), according to Strategas.

Mr. Nanda also notes that it is “inher­ently difficult” to measure the impact of tax rate changes as markets react to many different factors, such as the 1990s tech­nology bubble and the recovery from the 2000–2002 and 2007–2009 bear markets. Indeed, the capital gains rate in August 1981 was reduced from 28% to 20%, yet the S&P 500 declined 14% in the follow­ing six months amid double-digit interest rates and a double-dip recession.

Source: T.Rowe Price Report, Issue No 118, Winter 2013 , T.Rowe Price

Related ETFs:

SPDR S&P 500 ETF (SPY)
Vanguard Dividend Appreciation ETF (VIG)
SPDR S&P Dividend ETF (SDY)
iShares Dow Jones U.S. Select Dividend ETF (DVY)
PowerShares Dividend Achievers ETF (PFM)

Disclosure: No Positions

10 NYSE-Listed Auto Parts Makers

Auto-PartsThe auto components industry is a multi-billion dollar industry worldwide. The U.S. is home to the largest auto parts industry in the world since the country has the highest number of autos anywhere. Hence investing in this auto parts makers can be a winning strategy.

According to one research report, the U.S. auto parts industry has combined revenues of about $180 billion with about 4,000 firms sharing the market. Some of the top companies in the industry include companies include Dana, Delphi, Lear, Meritor, Visteon, and the automotive division of Johnson Controls (all in the US); Robert Bosch and Continental (Germany); DENSO and Aisin Seiki (Japan); Faurecia (France); and Magna International (Canada).

Ten NYSE-listed U.S.-based Auto Parts Makers are listed below:

1.Company:Johnson Controls Inc (JCI)
Current Dividend Yield: 2.42%

2.Company: Lear Corp (LEA)
Current Dividend Yield: 1.26%

3.Company: American Axle & Manufacturing Holdings Inc (AXL)
Current Dividend Yield: No dividends paid

4.Company: BorgWarner Inc (BWA)
Current Dividend Yield: No dividends paid

5.Company: Tenneco Inc (TEN)
Current Dividend Yield: No dividends paid

6.Company: Dana Holding Corp (DAN)
Current Dividend Yield: 1.20%

7.Company: Allison Transmission Holdings Inc (ALSN)
Current Dividend Yield: 1.04%

8.Company: Tower International Inc (TOWR)
Current Dividend Yield: No dividends paid

9. Company: Visteon Corp (VC)
Current Dividend Yield: No dividends paid

10. Company: Gentex Corp (GNTX)
Current Dividend Yield: 2.98%

Note: Dividend yields noted are as of Feb 28, 2013

Disclosure: No Positions

Companies such as Johnson Controls, Lear and Visteon are major players in the market.


Are Australian Cyclical Stocks Cheap Now?

The Australian economy remained strong during the global financial crisis relative to other developed countries. The IMF has projected Australia’s GDP to grow 3% this year. The country’s economy is closely tied with China’s since Australia is one of the largest commodity exporters to China. As fears of a hard-landing in China turned out to be incorrect for the most part, Australia’s economy is steady and growing although at  a slower pace than before. The unemployment rate remained steady in January at a seasonally- adjusted rate of just 5.4%.

According to an article by  Roy Maslen, Chief Investment Officer—Australian Value Equities, AllianceBernstein, Australian cyclical stocks offer once-in-a-generation value opportunities at current levels.

From  the article:

In Australia, the crowded equities trade since 2010, driven by fear of the global economic outlook and the sovereign debt crisis in Europe, has been in defensive stocks such as consumer staples, healthcare and property. As investors drove up valuations of these stocks, a lot of Australian cyclical companies—many of which have very strong balance sheets and cash flows—have become unusually cheap. Consequently, the value opportunity in Australian equities, expressed as the “value spread” or discount of the cheapest 20% of stocks to the most expensive 20% of stocks, is close to record highs (Display).

Click to enlarge

Australia-Value-Opportunities-Chart

Source: Finding Value in Australian Equities, AllianceBernstein Blog on Investing

Five Australian stocks from different sectors trading on the US markets are listed below with their current dividend yields:

1.Company: Westpac Banking Corp (WBK)
Current Dividend Yield: 5.44%
Sector: Banking

2.Company: National Australia Bank Ltd (NABZY)
Current Dividend Yield: 6.00%
Sector: Banking

3.Company: Australia and New Zealand Banking Group Ltd (ANZBY)
Current Dividend Yield: 5.15%
Sector: Banking

4.Company: BHP Billiton Ltd (BHP)
Current Dividend Yield: 3.02%
Sector: Metals & Mining

5.Company: Telstra Corp Ltd (TLSYY)
Current Dividend Yield: 6.12%
Sector: Telecom

Since most of the Australian firms are not listed on the organized US exchanges, the best way to gain exposure to the country’s cyclical sector is investing via the iShares MSCI Australia ETF (EWA). This ETF has 73% of the portfolio assets in cyclicals. With about $3.0 billion assets the fund’s dividend yield was about 5.18% at the end of January.

Note: Dividend yields noted are as of Feb 28, 2013

Disclosure: No Positions

Related:

Is Australia an Insulated Safe-Haven Investment? (Aug 30, 2012),  Charles Schwab & Co.

A Note On Spanish Banks’ Exposure To Latin America

The Spanish banking sector has been hit hard in the past few years due to the Global Financial Crisis and then the European Sovereign Debt Crisis. Bank stocks in Spain have recovered from the March 2009 lows although they are nowhere near their pre-crisis levels.

Despite all the continuing troubles at home, some investors are attracted to Spanish bank stocks due to their overseas exposure particularly to the fast-growing Latin American economies. Since Spain used to rule much of Latin American in the past, strong colonial ties still bind the region to Spain. The following chart shows the high exposure of Spanish banks to Latin America:

Click to enlarge

Spanish-Banks-in-Latin-America


Source: Spanish banks boast strongest FOS network in Latam, The Banker

The Banker magazine noted:

With aggregate assets of $494.5bn, Spanish-owned banks have the strongest foreign-owned subsidiary presence in Latin America.

It is interesting to see U.S. banks having the second highest presence in the region. Bank of Novo Scotia (BNS), one of Canada’s top five banks, has a solid foot print in many Latin American and Caribbean countries.

Currently Banco Santander SA (SAN) and Banco Bilbao Vizcaya Argentaria S.A (BBVA) have dividend yields of 11.16% and 5.31% respectively.

The five-year performance of SAN and BBVA is shown below:

SAn-vs-BBVA-5-Years

Source: Yahoo Finance

Note: Dividend yields noted are as of Feb 22, 2013

Disclosure: Long SAN, BBVA, BNS

A Review of the S&P 500 Index

The S&P 500 is one of the widely followed U.S. benchmark equity indices. This index is a better barometer of the U.S. markets than the Dow Jones Industrial Average or the NASDAQ indices. Here are some interesting facts about S&P 500:

  • The index was first published in 1957.
  • The 500 companies in the index are the leading companies in the leading sectors of the U.S. economy capturing 75% coverage of U.S. stocks
  • The sector breakdown is shown in the chart below:

Click to enlarge

SP500-Sector-Breakdown

  • The average dividend yield of the index is about 2%.
  • As of Feb 27, 2013 the price return for 1, 3 and 5 years are 14.15%, 11.74% and  1.68%. But the total returns for the same periods are 16.78%, 14.14% and 3.97% respectively due to the addition of dividend returns.

Source: Standard & Poor’s

a) S&P 500 – Long Term Price Returns:

SP500-Returns-Long_TErm

b) S&P 500 – Price Returns since 2000:

SP500-Returns-Since-2000

Related ETF:

SPDR S&P 500 ETF (SPY)

Disclosure: No Positions