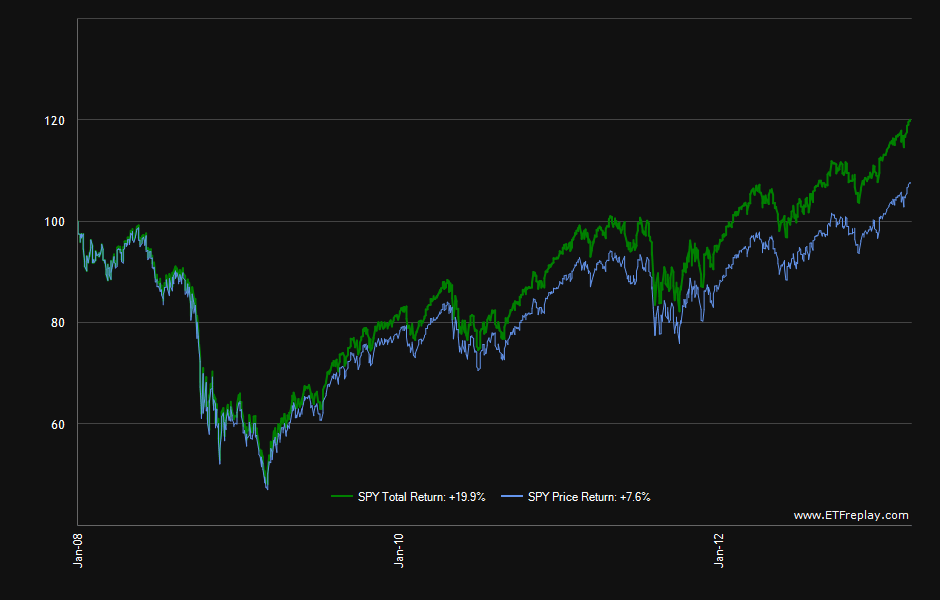
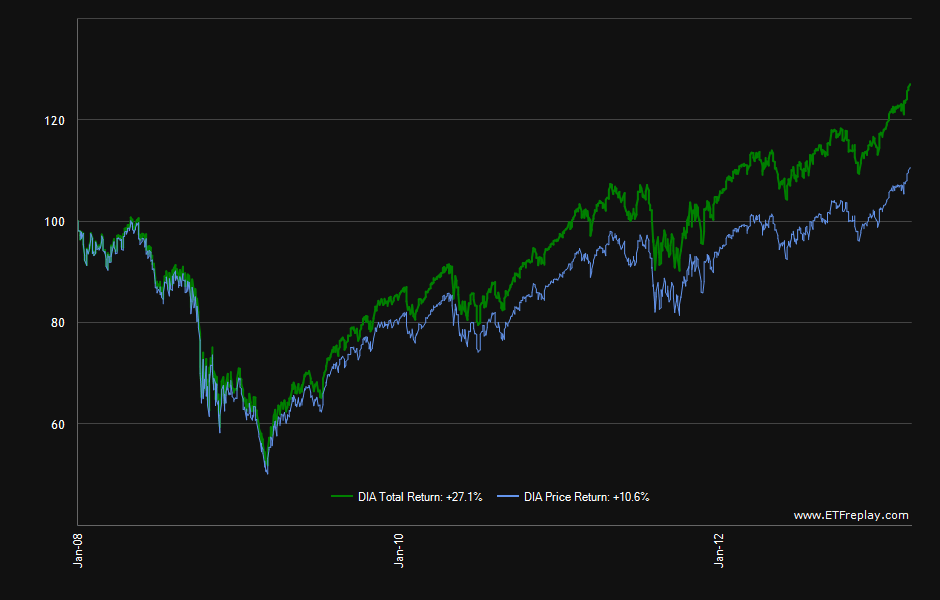
Diversification helps reduce risk and volatility of a portfolio. Some investors falsely assume that diversification eliminates risks altogether. This is not true. Diversification only helps to reduces risk but not eliminate it. For example, a well-diversified portfolio of stocks may fall 15% when the market falls 20% or 25%. In a major market crash such as the one we saw in 2008-09, diversification would have helped a portfolio from a complete wipe-out.
While one type of diversification can be achieved by building a portfolio of various asset classes, further diversification is important necessary the equity portfolio of the portfolio. Simply putting all the money in one or two stocks or even five is a recipe for disaster. Depending on the size of a portfolio,one can diversify with 25-50 stocks. Since each stock behaves differently based the sector, earnings and so many other factors it is a wise idea to hold many stocks from a variety of sectors in order to reduce the risk of loss.
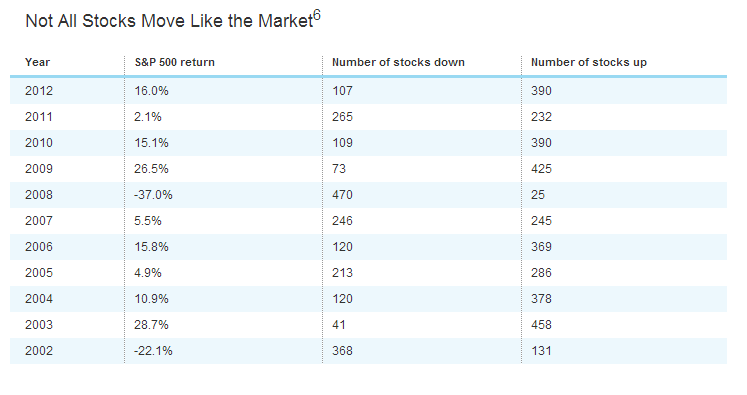
The following table shows how not all stocks follow the market:
Click to enlarge

Note: 6. Source: Schwab Center for Financial Research with data from Standard and Poor’s. Total return includes reinvestment of dividends.
Source: The Portfolio Pyramid: How to Diversify Your Stock Investments, Charles Schwab
In 2002, the S&P 500 index fell about 22.0% but 131 of the index components were up that year. Similarly in 2012, the S&P 500 had a total return of 16.0%. However not all the companies in the index was in the positive territory for the year. In fact, 107 of the index components had negative performance. Even during the major market meltdown in 2008 when the S&P 500 fell 37.0%, there were 25 stocks that went up. Since it is impossible to predict the future performance of stocks precisely, diversification is one way to play it safe.
The Journal had an interesting story about a barber and former investor Mr.William Flynn. Mr.Flynn lost most of his fortune during the bubble days of dot-com mania by putting his money in just one company – EMC Corp. (EMC). Later in 2007, he got wiped out again when he invested all his money in only one company for the second time. This time it was Eastman Kodak Co. that later filed for bankruptcy. This unique case is a reminder of how investors can easily lose their hard-earned money if they fail to diversify. The benefits of diversification cannot be underestimated. Diversification matters whether an investor has only $28.0K to invest or has $2.80 million to invest.
From the article:
Mr. Flynn claimed to have put 100 friends into EMC stock in 2000, including Mr. Capobianco. After Mr. Flynn’s appearance in the Journal in March 2000, EMC invited the barber to a shareholder’s meeting to meet company executives. Mr. Flynn later wore a jacket emblazoned with the EMC logo around town.
The barber held EMC stock to a peak of about $130 a share, only to ride it back down to less than $4. His fortune began with $150,000, swelled to $834,000 in September 2000, and then shrank back to about where it started.
Mr. Flynn said his wife, Jean, panicked. She had always worried about her husband’s big stock market bets. Mr. Flynn, meantime, said he grew forlorn.
“My wife and I were really shook up by it,” he said. “I was so despondent over it, I just let it go. I thought to myself, ‘If it comes back, it does. If it doesn’t, then, well….'”
EMC closed Friday at $24.30.
Mr. Flynn took a breather from trading before getting back into the market in 2007. He put some money in Eastman Kodak Co., EKDKQ +3.47% at the urging of a stock broker. The camera-maker filed for bankruptcy last year, wiping out the barber’s $28,000 investment.
A few weeks ago, Mr. Flynn made a decision to sell what was left in his portfolio. “I’ve been thinking about it a long time, and my wife and I talked about it,” Mr. Flynn said. “We came to the conclusion that the stock market is just not for us.”
Related ETFs:
SPDR S&P 500 ETF (SPY)
Disclosure: No Positions


