The U.S. topped the list of oil importing countries based on 2011 data as shown in the graphic below:
Click to enlarge
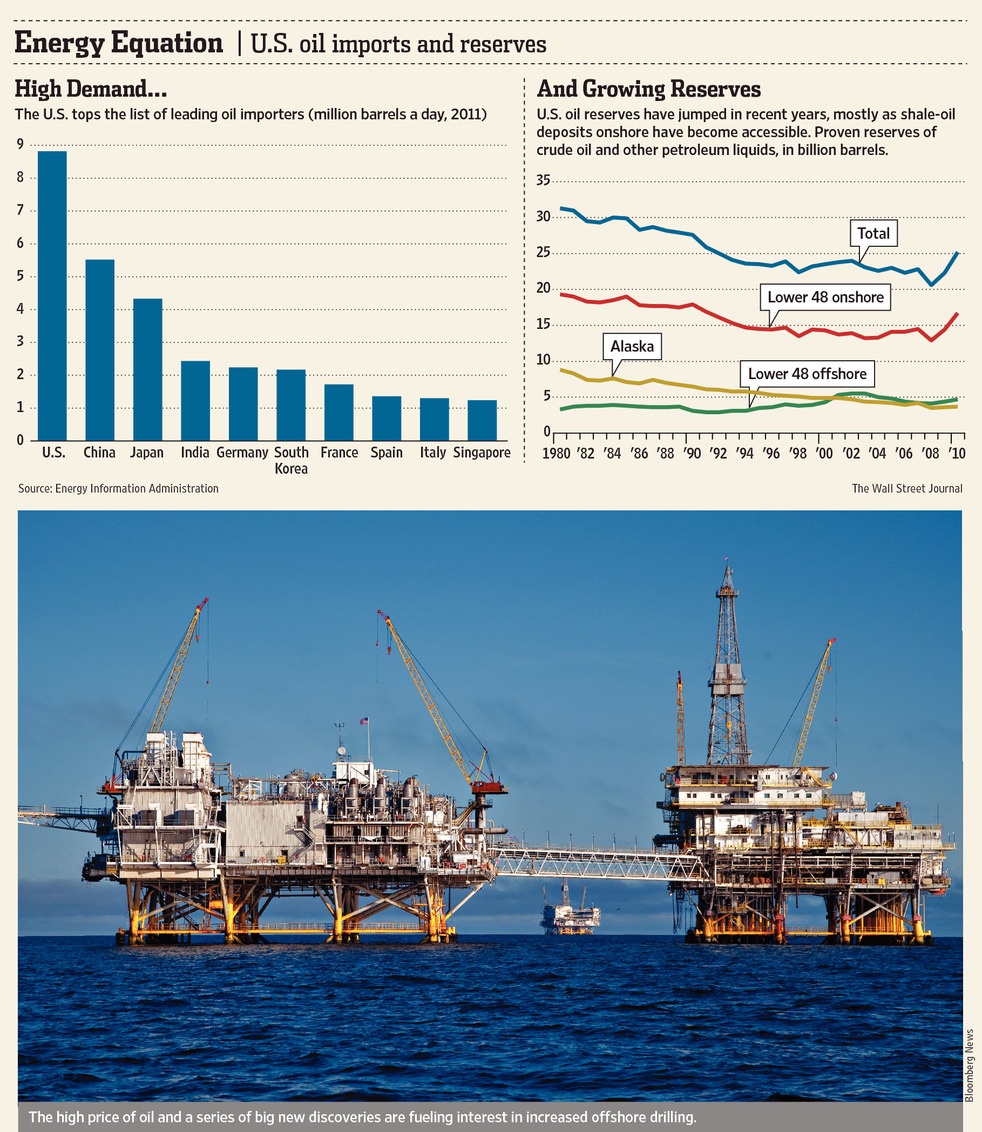
Source: Should the U.S. Expand Offshore Oil Drilling?, The Wall Street Journal, April 12, 2013
Here are some interesting facts from the EIA site:
- The U.S. was a net importer in 2011 and imported 45% of petroleum products consumed.
- U.S. dependence on foreign oil has been on the decline since 2005.
- The U.S. is the largest petroleum consumer and consumed 18.8 million barrels per day (MMbd) in 2011.
- Canada, not any Middle Eastern country, is the top supplier of crude oil.
- The following chart shows U.S. production, consumption and imports:
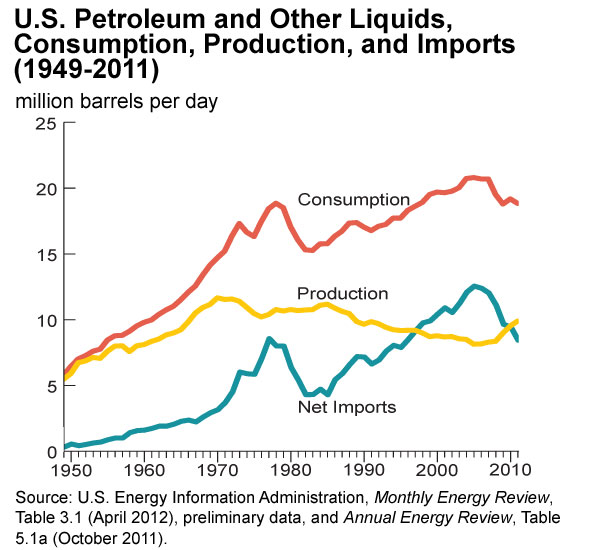
Source: How dependent are we on foreign oil?, EIA
An earlier article on the major players supplying the world oil market can be found here.