Mexico is Becoming More Attractive to U.S. Manufacturing Firms

Mexico’s economy boomed when the country signed the North American Free Trade Agreement (NAFTA) nearly two decades ago. The manufacturing sector especially thrived as U.S. firms shifted their operations to Mexico to take advantage of the cheap labor costs. As a result Mexico’s share of U.S. manufactured goods import rose from slightly about 4% in 1994 to about 13% in 2001 according to a report in the latest issue of IMF’s Finance & Development magazine.

Then the party almost came to a halt when communist China joined the World Trade Organization (WTO) in 2001. China’s entry into the WTO gave the country a strong edge over over Mexico since China could freely export its goods to the U.S. without any import restrictions.  Hence China’s goods exports to the U.S. rose significantly while Mexico’s exports  suffered.

From the report:

Between 2001 and 2005, Chinese manufacturing exports to the United States expanded at an average annual rate of 24 percent, while Mexico’s export growth decelerated sharply from about 20 percent a year to 3 percent on average each year over the same period. As a result, China’s share of U.S. manufacturing imports almost doubled by 2005, eroding the previous gains in market share by Mexico (see Chart 1).

Click to enlarge 

Share-of-US-Manufacturing-Imports

In recent years Mexico has been slowly regaining its lost manufacturing capacity as U.S. firms shift production to the country from China and other countries. This shift can be attributed to two reasons: labor cost and transportation cost.

Mexico-China-Wages-Comparison

The above chart shows that wages in China are rising yearly and is getting closer to Mexican wages. Wages in the manufacturing sector in Mexico has remained fairly stable over the years while wages in China has been increasing. So China is becoming less competitive for U.S. firms.

Another factor that makes Mexico more attractive to U.S. companies is transportation costs. Since Mexico is much closer to the U.S. than China, and a stable rail and road network exists between the two countries costs of shipping goods from Mexico to the U.S. is lower. Shorter distance also means that goods can reach U.S. destinations faster from Mexico than transported by ships from China. Unless wage inflation in China stabilizes manufacturing firms may continue to move out to other countries including Mexico, Vietnam, Philippines, etc. From an investment perspective, it is wise to keep on the Mexican economy and equities.

Mexican-Import-Costs


Source: The Comeback by Herman Kamil and Jeremy Zook, Finance & Development, march 2013,  IMF

Related ETFs:

iShares MSCI Mexico Capped Investable Market (EWW)
iShares FTSE/Xinhua China 25 Index (FXI)

Disclosure:  No Positions

The Largest US Companies By Revenue 2012

The largest U.S. companies from the Fortune Global 500 list for last year are listed below. These firms were ranked based on their revenues:

Country RankCompanyGlobal RankCityRevenues($ millions)
1Exxon Mobil2Irving452,926
2Wal-Mart Stores3Bentonville446,950
3Chevron8San Ramon245,621
4ConocoPhillips9Houston237,272
5General Motors19Detroit150,276
6General Electric22Fairfield147,616
7Berkshire Hathaway24Omaha143,688
8Fannie Mae26Washington137,451
9Ford Motor27Dearborn136,264
10Hewlett-Packard31Palo Alto127,245
11AT&T32Dallas126,723
12Valero Energy35San Antonio125,095
13McKesson37San Francisco122,734
14Bank of America Corp.46Charlotte115,074
15Verizon Communications50New York110,875
16J.P. Morgan Chase & Co.51New York110,838
17Apple55Cupertino108,249
18CVS Caremark56Woonsocket107,750
19International Business Machines57Armonk106,916
20Citigroup60New York102,939
21Cardinal Health61Dublin102,644
22UnitedHealth Group63Minnetonka101,862
23Kroger75Cincinnati90,374
24Costco Wholesale78Issaquah88,915
25Freddie Mac79McLean88,262
26Wells Fargo80San Francisco87,597
27Procter & Gamble86Cincinnati82,559
28Archer Daniels Midland92Decatur80,676
29AmerisourceBergen94Chesterbrook80,218
30INTL FCStone102New York75,498
31Marathon Petroleum106Findlay73,645
32Walgreen107Deerfield72,184
33American International Group109New York71,730
34MetLife114New York70,641
35Home Depot116Atlanta70,395
36Medco Health Solutions118Franklin Lakes70,063
37Microsoft119Redmond69,943
38Target120Minneapolis69,865
39Boeing123Chicago68,735
40Pfizer126New York67,932
41PepsiCo133Purchase66,504
42U.S. Postal Service135Washington65,711
43Johnson & Johnson138New Brunswick65,030
44State Farm Insurance Cos.140Bloomington64,305
45Dell147Round Rock62,071
46WellPoint150Indianapolis60,711
47Caterpillar155Peoria60,138
48Dow Chemical156Midland59,985
49Bunge160White Plains58,743
50United Technologies163Hartford58,190
51Comcast167Philadelphia55,842
52Kraft Foods170Northfield54,365
53Intel173Santa Clara53,999
54United Parcel Service177Atlanta53,105
55Best Buy184Richfield51,116
56Lowe's190Mooresville50,208
57Prudential Financial195Newark49,045
58Amazon.com206Seattle48,077
59Merck207Whitehouse Station48,047
60Lockheed Martin211Bethesda46,692
61Coca-Cola212Atlanta46,542
62Express Scripts Holding213St. Louis46,128
63Sunoco217Philadelphia45,765
64Enterprise Products Partners226Houston44,313
65Safeway232Pleasanton43,630
66Cisco Systems237San Jose43,218
67Sears Holdings245Hoffman Estates41,567
68Walt Disney249Burbank40,893
69Johnson Controls251Milwaukee40,833
70Schlumberger260Houston39,540
71Morgan Stanley261New York39,376
72Sysco262Houston39,324
73FedEx263Memphis39,304
74Abbott Laboratories268Abbott Park38,851
75DuPont270Wilmington38,719
76Google277Mountain View37,905
77Hess278New York37,871
78United Continental Holdings283Chicago37,110
79Honeywell International284Morris Township37,059
80CHS287Inver Grove Heights36,916
81Humana289Louisville36,832
82Goldman Sachs Group290New York36,793
83Ingram Micro294Santa Ana36,329
84Supervalu296Eden Prairie36,100
85Oracle300Redwood City35,622
86Delta Air Lines308Atlanta35,115
87Liberty Mutual Insurance Group312Boston34,671
88World Fuel Services313Miami34,623
89New York Life Insurance317New York34,394
90Plains All American Pipeline319Houston34,275
91TIAA-CREF323New York34,079
92Aetna327Hartford33,780
93Sprint Nextel328Overland Park33,679
94News Corp.332New York33,405
95General Dynamics339Falls Church32,677
96Allstate340Northbrook32,654
97HCA Holdings343Nashville32,506
98American Express344New York32,282
99Tyson Foods345Springdale32,266
100Deere348Moline32,013
101Murphy Oil352El Dorado31,446
102Philip Morris International355New York31,097
103Nationwide359Columbus30,698
104Tesoro366San Antonio29,927
1053M368St. Paul29,611
106Time Warner381New York28,974
107Northrop Grumman395Falls Church28,058
108DirecTV406El Segundo27,226
109Publix Super Markets407Lakeland27,179
110McDonald's410Oak Brook27,006
111Avnet414Phoenix26,534
112Tech Data415Clearwater26,488
113Macy's417Cincinnati26,405
114Rite Aid421Camp Hill26,121
115International Paper424Memphis26,034
116Travelers Cos.431New York25,446
117Staples437Framingham25,022
118Alcoa439New York24,951
119Northwestern Mutual441Milwaukee24,861
120Raytheon442Waltham24,857
121Halliburton444Houston24,829
122Eli Lilly454Indianapolis24,287
123Emerson Electric456St. Louis24,234
124Massachusetts Mutual Life Insurance457Springfield24,226
125Occidental Petroleum458Los Angeles24,216
126AMR463Fort Worth23,979
127Fluor473Irving23,381
128TJX478Framingham23,192
129Goodyear Tire & Rubber487Akron22,767
130Xerox488Norwalk22,626
131Aflac497Columbus22,171
132Manpower500Milwaukee22,006


Source: Fortune 500, Fortune

Of the 500 firms in the list, 132 are from the U.S. Exxon Mobil(XOM) took the top rank followed by Walmart Stores(WMT), Chevron(CVX), ConocoPhillips (COP) and General Motors(GM) among the top five. U.S. Postal Service was ranked at 42 with a revenue of $65.0 billion. UPS(UPS) and FedEx(FDX) took the 54th and 73rd spots.

Ten companies from the above list are listed below for further research:

1.Company: Emerson Electric Co (EMR)
Current Dividend Yield: 2.90%
Sector: Electrical Equipment

2.Company: ConocoPhillips(COP)
Current Dividend Yield: 4.33%
Sector: Oil, Gas & Consumable Fuels

3.Company: American Express Co (AXP)
Current Dividend Yield: 1.33%
Sector: Consumer Finance

4.Company: Abbott Laboratories(ABT)
Current Dividend Yield: 1.67%
Sector: Pharmaceuticals

5.Company: Mondelez International Inc (MDLZ)
Current Dividend Yield: 1.82%
Sector: Food Products

6.Company: Caterpillar Inc (CAT)
Current Dividend Yield: 2.40%
Sector: Machinery

7.Company: Schlumberger NV (SLB)
Current Dividend Yield: 1.70%
Sector: Energy Equipment & Services

8. Company: Fluor Corp (FLR)
Current Dividend Yield: 1.01%
Sector: Construction & Engineering

9.Company: Johnson & Johnson (JNJ)
Current Dividend Yield: 3.09%
Sector: Pharmaceuticals

10.Company: General Dynamics Corp (GD)
Current Dividend Yield: 3.25%
Sector: Aerospace & Defense

Note: Dividend yields noted are as of Mar 21, 2013

Disclosure: No Positions

To download the complete Fortune 2012 list in Excel click here.

Downloads Page Added !

Recently I added a “Downloads” tab on this site.

Download-Page

On this page you can download many documents such as a list of NYSE stocks, OTC stocks, Fortune Global 500 and Fortune 500 lists in excel and other formats.

Fortune 500 US lists from the latest to all the way up to 1955 are listed here.

More documents for download will be added on a regular basis.

Are Frontier Markets The Next Emerging Markets?

Frontier markets are the wild west of the investing universe. These markets include countries like Côte d’Ivoire, Kazakhstan, Bangladesh, Nigeria, Qatar, Tunisia, etc. The equity markets in some of these countries have performed well in recent years which is attracting investors’ attention. In a recent article I discussed about these markets and suggested that investors should not into dive into them now.

Investing in frontier markets is not for the faint-hearted due to many risks including political, economic, currency, lack of transparency, etc. Many of these countries will remain as frontier markets for the foreseeable future. While a few of these markets may graduate to emerging market status most of them will not. Investors’ enthusiasm for frontier markets is evident with their rising interest in ETFs for these markets. However this enthusiasm may be misplaced.

From the article Are Frontier Markets Ready for Prime Time? in Bloomberg BusinessWeek:

Even so, the frontier represents 30 percent of the world’s population, crammed into some of its fastest-growing economies. Nourished with enough stability and free-market reforms, and the noblesse largesse of foreign investors, frontier markets are primed to go more mainstream, especially with ETFs like the fledgling iShares MSCI Frontier 100 (FM) now casting for talent. Seeded with just $10 million when it launched in September, the offering has since swelled to $54 million in assets. The question now is how well this fund, and rival Guggenheim Frontier (FRN), can track the momentum of these scattered tiny markets, all while taking in Western money in an orderly fashion.

The average trading volume in the iShares MSCI Frontier 100 ETF (FM) has more than doubled since its launch last year.

Despite their going popularity, frontier markets are still tiny relative to global equity markets. As of late last year, frontier markets represented less than 1% of the global market based on three indices that track them per a research report by Vanguard. Hence the majority of global equity opportunities are in the developed and emerging world.

Click to enlarge

Size-of-Equity-Markets-1

In terms of percentage of global market capitalization also, frontier markets are very small compared to emerging markets.

Frontier-vs-Emerging-Markets-Market-Cap-2

Frontier markets have always lagged emerging markets in market capitalziation at every period in history. For example, while in 1990 emerging markets acocunted for 2% of global market cap as of September 2012 Frontier markets accoutned for just 0.36%.of the global market. After 10 years, emerging markets had grown to 6% of the global market in 2000. But frontier markets have never crossed 0.54% at any point in history.

Source: Exploring the next frontier: A review of frontier equity markets, Vanguard Group

Related ETFs:

  • iShares MSCI Frontier 100 Index (FM)
  • Vanguard FTSE Emerging Markets ETF (VWO)
  • iShares MSCI Emerging Markets Index (EEM)

Disclosure: No Positions

Thailand’s SET Index Reached 19-Year High

The SET index of Thailand equity market reached a 19-year high this week according to an article in The Wall Street Journal.  The Thai bhat also reached its highest level in 5 years. It is interesting that Thailand’s economy is doing so well considering that the country seems to have a shaky political system with the famous “Red-Shirt” political protests that occurred in 2010.

From the Journal article:

Click to enlarge

Thailand-WSJ-Graphic

Moreover, there is broad appeal in Thai assets as the economy strengthens and the government sticks to investor-friendly policies. The economy expanded 6.4% last year, as activity bounced back from damaging floods in 2011, and analysts say growth will likely remain healthy this year, buoyed by a corporate tax-rate cut and government support for first-time car buyers.

Fitch Ratings this month raised the nation’s credit rating a notch to triple-B-plus, while the central bank signaled this week that there is no need for concern over the baht’s recent rise, giving investors the green light to keep buying.

“The medium-term fundamentals remain positive with strong foreign direct investment flows,” said Guan Yi Low, investment director for fixed income with Eastspring Investments, which manages around $94.4 billion in assets across Asia. “We believe the pace of [baht] appreciation is likely to continue.”

Source: Thailand’s Broad Appeal Bolsters Its Currency,  The Wall Street Journal, Mar 21, 2013

Some interesting economic facts of Thailand:

  • Population: 67.0 million
  • Economy Type: Free-market Economy
  • GDP: $646.0 billion (in 2012 based on Purchasing Power Parity)
  • Unemployment Rate: 0.20% in 2012 (estimate)
  • Budget: A deficit of 2.4% of GDP in 2012 (est)

A brief overview of the economy:

With a well-developed infrastructure, a free-enterprise economy, generally pro-investment policies, and strong export industries, Thailand achieved steady growth due largely to industrial and agriculture exports – mostly electronics, agricultural commodities and processed foods. Bangkok is trying to maintain growth by encouraging domestic consumption and public investment. Unemployment, at less than 1% of the labor force, stands as one of the lowest levels in the world, which puts upward pressure on wages in some industries. Thailand also attracts nearly 2.5 million migrant workers from neighboring countries. Bangkok is implementing a nation-wide 300 baht per day minimum wage policy and deploying new tax reforms designed to lower rates on middle-income earners.

Source: CIA’s World Factbook site

None of the Thai companies are listed on the organized US stock exchanges. The best way to invest in Thailand stocks is via the iShares MSCI Thailand Investable Market Index Fund (THD).

The 5-year performance of the iShares Thailand ETF:

Click to enlarge

Thai-ETF-5-Year-Return

Source: Yahoo Finance

The fund has just over $1.0 billion in assets and the number of holdings is 92. This ETF is highly concentrated with Financials accounting for 40% of the portfolio and the top 10 holdings amounting to about 50% of the fund.

Disclosure: No Positions

Update(Nov 28, 2015):


Long-term return chart of Thailand SET Index:

Click to enlarge

Thai Stock Market Performance


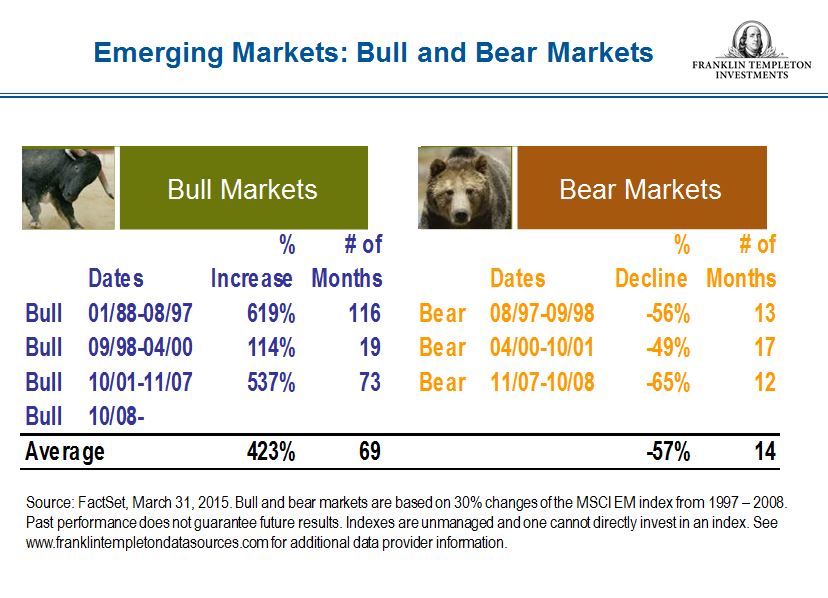
Source: Franklin Templeton