Charts are great way to visually represent data. The widely popular phrase “A picture is worth a thousand words” is indeed true, in most scenarios. However sometimes one has to dig deeper into the data shown in the chart in order to get a better understanding the information being displayed.
From an article titled Real Estate: More Than Just a Home by David Lee, fund manager at T.Rowe Price:
Mention real estate, and many people think of the place they call home. In the investment world, however, the sector encompasses a broad array of commercial opportunities spanning the globe. And, as a sector, U.S. real estate has been among the top performers of the past decade.
The Wilshire U.S. Real Estate Securities Index outperformed the S&P 500 Index by a wide margin over the 10 years ended December 31, 2012, and turned in a stellar 17.55% return through the turmoil and uncertainties of the past year (see chart below). Global real estate did even better with the FTSE EPRA/NAREIT Developed Real Estate Index, returning 28.65% in 2012.
Click to enlarge
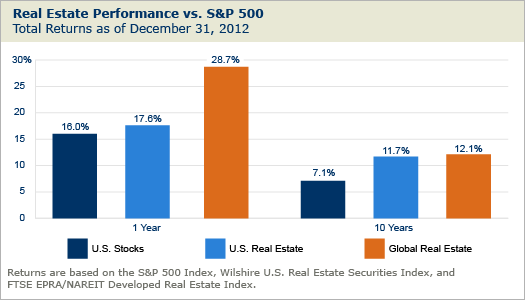
Source: Real Estate: More Than Just a Home, T.Rowe Price
Though the chart looks pretty and shows real estate assets outperforming stocks, one can argue whether the actual return earned by an investor is higher with REITs as opposed to stocks, if the investor held these assets in a taxable account.
U.S. stocks as shown by the dark blue bar had a total return of 16.0% in 2012 and REITs as yielded a 17.6% total return. REITs therefore outperformed stocks by 1.6%. This can hardly be called “stellar” because dividends paid out REITs are taxed as ordinary income for tax purposes whereas dividends earned from stocks can be “Qualified Dividends” subject to a lower tax rate of just 15% even for investors in the top tax bracket. Though REITs may assign a portion of the dividends paid as qualified at the end of the year the majority of the dividends will still be “Unqualified Dividends” that will incur a higher tax rate. Generally the ordinary income tax rate for most people will be around 28% to 33%. Hence though REITs had a slightly higher return than stocks last year, when taxes are considered the total return for stocks will be higher. So in reality an investor would have been better off investing in stocks in a taxable account instead of real estate securities. The same logic can be applied for the 10-year period as well.
For an investor with a tax-deferred account such as Traditional IRA, REITs would have been a better option since they had a higher return both in the 1-year and 10-year periods. A Roth IRA would be even better since the original investment and earnings can be withdrawn without any tax consequences during retirement.
Investors should definitely allocate some of the assets in their portfolios to REITs for diversification purposes. However it is highly important to determine in which type of account one has to hold REITs in due to the tax issue discussed above.
Related ETFs:
- iShares Dow Jones U.S. Real Estate Index Fund (IYR)
- Vanguard REIT ETF (VNQ)
- SPDR Dow Jones International Real Estate Fund (RWX)
- SPDR S&P 500 ETF (SPY)
Disclosure: Long RWX