Why Holding Bonds is Important in a Well-Diversified Portfolio

The yield on the 10-year Treasury note rose about 0.08% to close at 2.16% on Friday.The 30-year U.S. Treasury bond rose 0.07% and closed at 3.32%. The yield on the 10-year Treasury bond rose dramatically by 27% in last month alone. Bond yields and prices are inversely related to each other. Hence as yields rise bond prices fall.

Currently investors expect the Federal Reserve to wind down its bond-buying program later this year and interest rates to rise. A rise in interest rates would lead to a fall in bond prices. So investors may be tempted to dump bonds now and hold only other assets such as stocks, cash, gold, etc.According to a research report published by The Schwab Center for Financial Research (SCFR), bonds still play a role in an overall portfolio for the following reasons: Diversification and reduced volatility, Income, Time, Capital Preservation and A Stable Foundation.

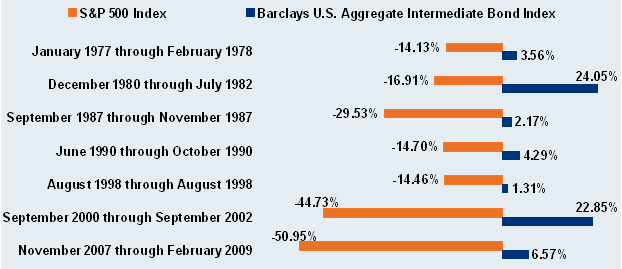
To support the argument for holding bonds in a portfolio, the authors of the report Kathy A. Jones, Rob Williams and Collin Martin included in the following neat chart comparing the performance of stocks and bonds when stocks declined 14% or more since the 1970s:

Click to enlarge

Bond-vs-Stock-Returns


Source:  Schwab Bond Insights: Timing the Taper, Charles Schwab

The above chart shows that when stocks declined heavily bonds yielded a small positive or even a substantially higher return. Hence holding bonds can provide a cushion effect to a portfolio of stocks. In addition, bonds tend to reduce a portfolio’s volatility as equities are generally more volatile.

During the recent global financial crisis (from November 2007 thru February 2009), when stocks plunged by over 50% as measured by the S&P 500, bonds yielded a decent return of 6.57%. When the dot com bubble popped in early 2000, stocks fell by about 45% but bonds had an excellent return of about 23.0%.The positive impact of holding bonds during such periods cannot be understated.

It is a wise idea to hold bonds as of part of a well-diversified portfolio.  However the question of how much fixed income securities should one hold depends on many factors including age, tax bracket, goal, investment horizon, etc. of an investor.

Five bond ETFs with their current yields are listed below for consideration:

1. iShares iBoxx $ Investment Grade Corporate Bond ETF (LQD)
Distribution Yield = 3.61%

2. iShares TIPS Bond ETF (TIP)
Distribution Yield = 2.97%

3. Vanguard Total Bond Market ETF (BND)
SEC Yield = 1.65%

4. iShares Core Total U.S. Bond Market ETF (HYG)
Distribution Yield = 2.11%

5. SPDR® Barclays High Yield Bond ETF (JNK)
30-Day SEC Yield = 4.97%

Disclosure: No Positions

Knowledge is Power: Tennis, Robber Barons, Emerging Markets Edition

Time for a change of approach in Europe?,  Invesco Perptual

The problem with tennis in America, DNA

American decline has been exaggerated: Olive, The Star

Cable companies as robber barons (The Guardian)

Why you should ignore the “slowdown” in emerging markets (Trustnet)

What Silicon Valley can teach Canadian businesses about ‘lean innovation’ (Financial Post)

Singapore-Downtown

Singa lion, Singapore

Investors’ Home Bias in Select Countries is Falling

One of the traits common to most investors worldwide is the concept of “home bias” with respect to investments. Home bias simply means investors prefer to invest in their home countries than in foreign countries since they may be more familiar with the companies located in their countries than abroad. However following this strategy may not be the best option for investors. For example, thousands of companies exist in other countries whose stocks may offer the potential for higher returns than the ones in home countries. According to the latest World Federation of Exchange data, the total number of listed globally is over 45,000. But in the NASDAQ and NYSE, just over 4,000 domestic companies are listed. Investors who confine themselves to the U.S. are more likely to miss out on the investment opportunities on the remaining 40,000+ companies.

The problem of home bias has been reducing in Australia, US and the UK in recent years as more investors venture abroad according to an article by Nick Armet of Fidelity Investments, UK. I believe the advent of ETFs and other tools that provide easy access to far flung markets is also contributing to investors’ interest in foreign stocks.

From the Fidelity article:

Mere exposure could help to explain the puzzle of home bias in investment. This relates to the marked preference many investors display towards domestic stocks. This is despite the fact international markets could offer better alternatives as well as improved portfolio diversification.

The chart below shows the extent of home bias in the US, UK and Australia. Home bias has fallen over the last decade showing an increased preparedness to invest internationally, but it remains a significant issue. Given the large weight of the US in the world equity market, investors there have more justification for large domestic weightings but they are still guilty of favouring their domestic market. In the UK and Australia, investors’ heavy domestic bias gives rise to even larger overweights to domestic equities given the lower weighting of these markets in terms of global market capitalisation.

Click to enlarge

home-bias

A range of academic studies support this finding. Coval and Moskowitz showed that home bias can apply within domestic markets, with investors exhibiting a preference for locally headquartered firms.2 Gur Huberman found the shareholders of regional utility companies tended to live in the service areas of those companies.3

The impact of home bias is felt in other asset classes too. Real estate investors have historically tended to prefer local or regional markets. Financial institutions tend to favour their own sovereign government bonds. Investors seeking inflation protection prefer domestic inflation linked bonds despite evidence that global portfolios of inflation linked securities can provide both protection and greater opportunity for managers to add value. There can be other valid reasons for such preferences, yet there can be little doubt familiarity is at play here.

Note:

2. Coval, Josua D. and Moskowitz, Tobias J. (1999) “Home Bias at Home: Local Equity Preference in Domestic Portfolios.” Journal of Finance, 1999, 54(6), pp. 2045-73.

3. Huberman, G. (2001). ‘Familiarity Breeds Investment’. Review of Financial Studies 14 (3): 659–680

Source: Familiarity breeds investment, Fidelity Investments,  UK

For US investors , some of the advantages of investing in foreign stocks include:

  • Many foreign firms have higher dividend yields than their U.S. peers. For years, the S&P 500 has had a dividend yield of just around 2.00%.
  • Potential to earn higher returns from fast-growing emerging markets.
  • Diversification benefits since many foreign markets play to a different tune than U.S. markets.
  • Having all investments such as a home, cash savings, CDs, etc. in the U.S. may be not be the best idea should the U.S. dollar lose it hard currency status or the paper currency dollar plunges in value since it backed by nothing other than faith in Uncle Sam or some other calamity happens making U.S. assets unattractive to foreign investors.

Related ETFs:

  • iShares MSCI United Kingdom Index (EWU)
  • iShares MSCI Australia Index (EWA)
  • SPDR S&P 500 (SPY)

Disclosure: No Positions

The Largest Chinese Companies By Revenue 2012

The largest Chinese firms by revenues from the Fortune Global 500 list for 2012 are listed below:

Country RankCompanyGlobal RankCityRevenues($ millions)
1Sinopec Group5Beijing375,214
2China National Petroleum6Beijing352,338
3State Grid7Beijing259,142
4Industrial & Commercial Bank of China54Beijing109,040
5China Construction Bank77Beijing89,648
6China Mobile Communications81Beijing87,544
7Agricultural Bank of China84Beijing84,803
8Noble Group91Hong Kong80,732
9Bank of China93Beijing80,230
10China State Construction Engineering100Beijing76,024
11China National Offshore Oil101Beijing75,514
12China Railway Construction111Beijing71,443
13China Railway Group112Beijing71,263
14Sinochem Group113Beijing70,990
15China Life Insurance129Beijing67,274
16SAIC Motor130Shanghai67,255
17Dongfeng Motor Group142Wuhan62,911
18China Southern Power Grid152Guangzhou60,538
19China FAW Group165Changchun57,003
20China Minmetals169Beijing54,509
21CITIC Group194Beijing49,339
22Baosteel Group197Shanghai48,916
23China North Industries Group205Beijing48,154
24China Communications Construction216Beijing45,959
25China Telecommunications221Beijing45,170
26China Resources National233Hong Kong43,440
27Shenhua Group234Beijing43,356
28China South Industries Group238Beijing43,160
29Ping An Insurance242Shenzhen42,110
30China Huaneng Group246Beijing41,481
31Aviation Industry Corp. of China250Beijing40,835
32China Post Group258Beijing40,023
33HeBei Iron & Steel Group269Shijiazhuang38,722
34Jardine Matheson275Hong Kong37,967
35China Metallurgical Group280Beijing37,613
36People's Insurance Co. of China292Beijing36,549
37Shougang Group295Beijing36,117
38Aluminum Corp. of China298Beijing35,839
39China National Aviation Fuel Group318Beijing34,352
40Wuhan Iron & Steel321Wuhan34,260
41Bank of Communications326Shanghai33,872
42Jizhong Energy Group330Xingtai33,661
43China United Network Communications333Shanghai33,336
44China Guodian341Beijing32,580
45Jiangsu Shagang Group346Zhangjiagang32,097
46China Railway Materials349Beijing31,991
47Huawei Investment & Holding351Shenzhen31,543
48Hutchison Whampoa362Hong Kong30,023
49China National Building Materials Group365Beijing30,022
50Sinomach367Beijing29,846
51China Datang369Beijing29,603
52Lenovo Group370Beijing29,574
53China Ocean Shipping384Beijing28,797
54Power China390Beijing28,289
55COFCO393Beijing28,190
56Henan Coal & Chemical397Zhengzhou27,919
57ChemChina402Beijing27,707
58Tewoo Group416Tianjin26,411
59China Electronics425Beijing26,023
60Zhejiang Materials Industry Group426Hangzhou25,833
61China Huadian433Beijing25,270
62China Shipbuilding Industry434Beijing25,145
63Shandong Weiqiao Pioneering Group440Shandong24,906
64Shanxi Coal Transportation & Sales Group447Taiyuan24,533
65China Pacific Insurance (Group)450Shanghai24,429
66China Power Investment451Beijing24,400
67Shandong Energy Group460Jinan City24,131
68Ansteel Group462Anshan24,089
69Zhejiang Geely Holding Group475Hangzhou23,356
70Greenland Holding Group483Shanghai22,873
71Xinxing Cathay International Group484Beijing22,832
72Kailuan Group490Tangshan22,519
73China Merchants Bank498Shenzhen22,094

Source: Fortune Global 500, Fortune

Frontier Markets Are Outperforming Emerging Markets This Year

Frontier markets which includes countries such as Pakistan, Nigeria, Kenya etc. are outperforming emerging markets so far this year according to a report in FT beyondbrics blog quoting Citi research.

The chart below shows how many frontier countries are beating emerging countries:

Click to enlarge:

FM-vs-EM-chart


Source:  Frontier markets: handle with care, FT beyondbrics

From the report:

The MSCI Frontier Market index has gained 13.31 per cent in the first five months of the year – its best start since the index was created five years ago. By contrast, the MSCI Emerging Markets index has fallen 4.4 per cent for the year to the end of May. As analysts at Citi noted: “You have to go back to 2005 to find a year in which FM thrashed EM so decisively.”

It should be noted that most frontier markets are not suitable for ordinary retail investors since they are highly risky and accessing information on frontier companies is not easy. The best way to invest in these markets is via an ETF or a mutual fund. Individual stocks are not the way to access these markets.

The two large Frontier Market ETFs are iShares MSCI Frontier 100 Index Fund (FM) and Guggenheim Frontier Markets ETF (FRN). Both the ETFs are not too big with assets of over $100 million only.This shows investors are not piling into these markets yet. The iShares fund has about 26% of the assets in Kuwait.

Disclosure: No Positions