 Swedish bank Skandinaviska Enskilda Banken AB, also known as SEB, started trading on the US OTC markets as an unsponsored ADR effective Nov 12, 2013 under the ticker SVKEY. The ADR to Ordinary ratio is 1:1.
SEB mainly serves corporations in the Nordic and other areas. From the corporate website:
We are different from other Nordic banks in several ways, but mainly through our unique business mix with an emphasis on corporate banking and through deep and long-term relationships with our customers in the Nordic and Baltic countries and Germany.
We are also proud of our history – more than a century and a half of it. This gives us a firm tradition to stand on but has also taught us to be resilient and take a long-term perspective. Above all, it has given us an insight: close relationships with our customers are paramount.
A few interesting facts about SEB:
- Was founded in 1856
- Currently has operations in 20 countries
- Home office is in Stockholm, Sweden
- Has 16,000 employees
The bank serves 2,800 corporations and institutions, 400,000 small and medium enterprises and about 2 million private individuals.
In the domestic market, SEB’s stock has handily beaten the NASDAQ OMX 30 and the FTSE W.European Banks index as shown in the chart below:
Click to enlarge
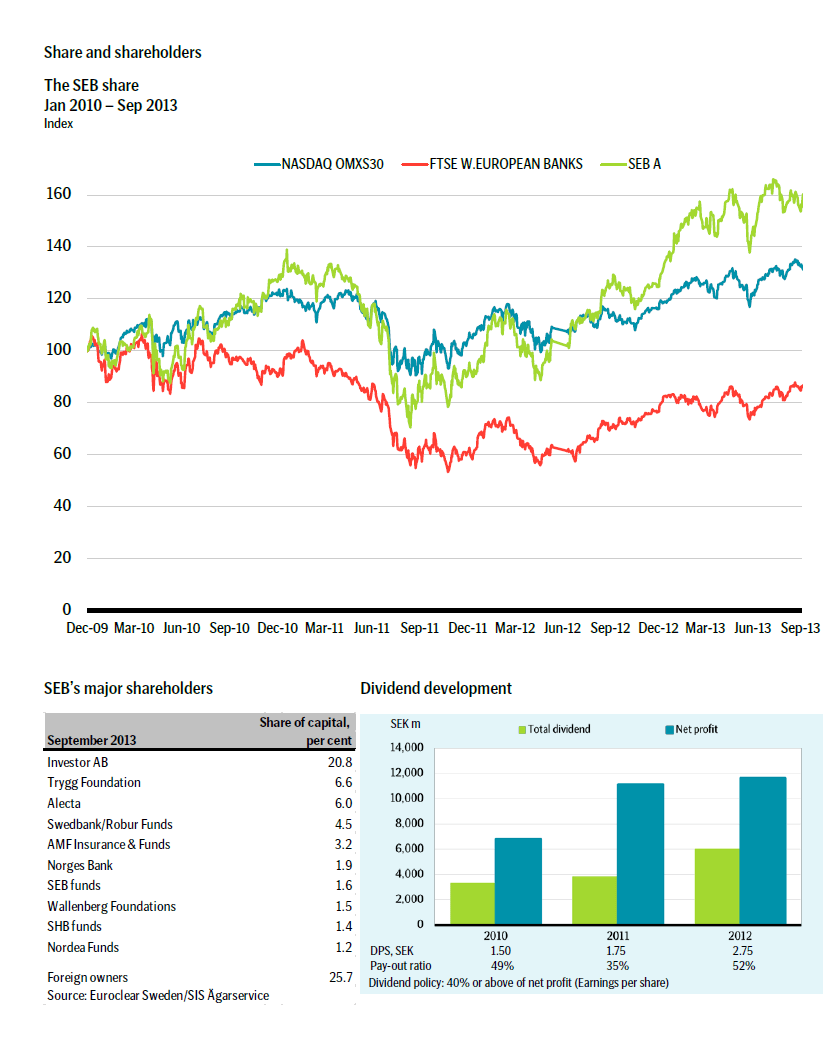
Source: SEB
The total outstanding shares is about 2.2 billion and the major shareholders are shown in the above image. It should be noted that the largest shareholder with a stake of over 20% is the Swedish Wallenberg family through their investment company Investor AB.
In the US, the ADR opened for trading at $11.89 on Nov 15, 2013 and has traded in the $11 to $12 range since then closing at $12.28 on Friday. Daily trading volume is very light with a high of only 9,000 shares traded on one day only since Nov 15th.
You can download the 2013 3rd Quarter Factbook here (pdf).
For more info please visit SEB’s Investors Relations site.
Disclosure: No Positions