I came across the following chart showing the behavior of the typical mutual fund investor:
Click to enlarge
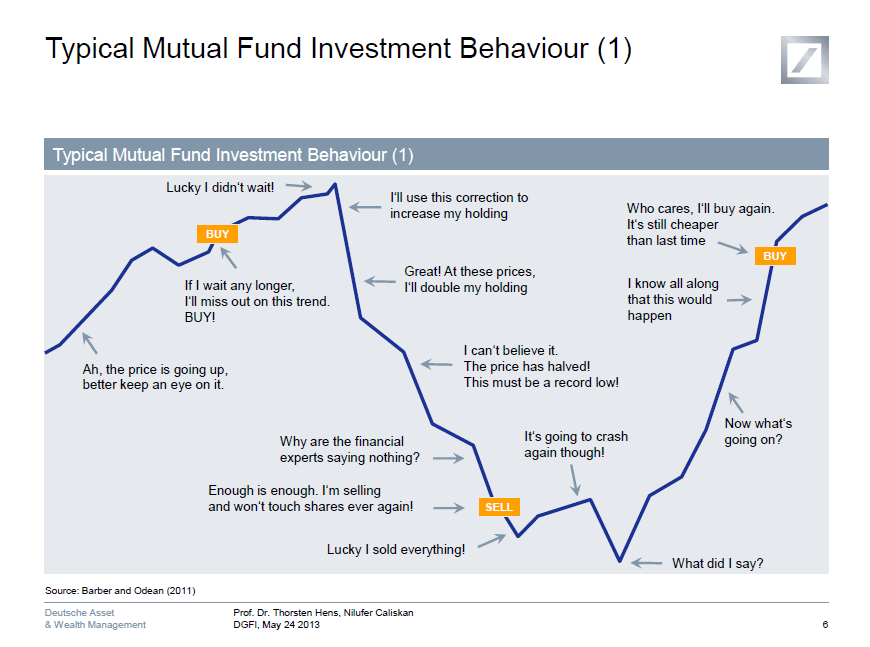
Source: Behavioural Finance and Mutual Fund Flows An International Study, Deutsche Asset & Wealth Management
Obviously the essence of the chart is applicable to stock and ETF investors as well.
Related:
Why We Buy in a Marked-Up Market, Jan 13, 2014, NY Times