The Top 10 Most-Liquid DR Programs from Asia, EMEA and Latin America 2013

Citi Depository Receipt Services recently its annual “Depositary Receipt Services Year-End 2013 Report” which has many interesting facts.

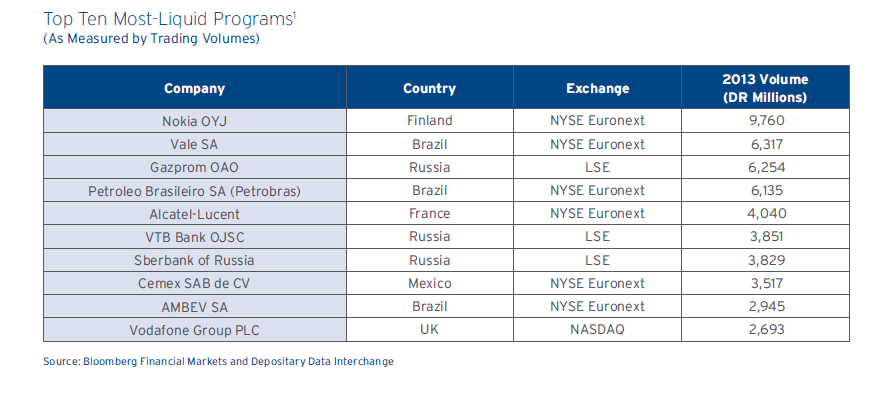
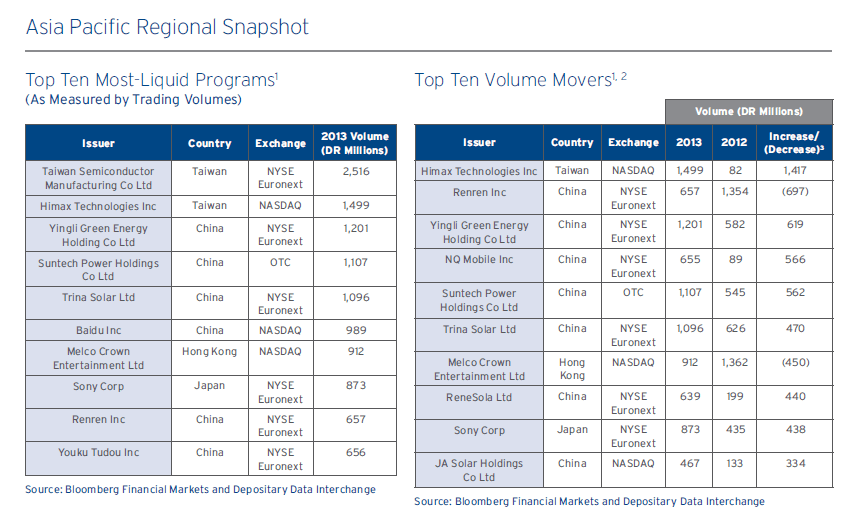
The table below shows the top 10 most-liquid DR programs from Asia in 2013 by trading volumes:

Click to enlarge

Top 10 Most Liquid DRs - Asia-1


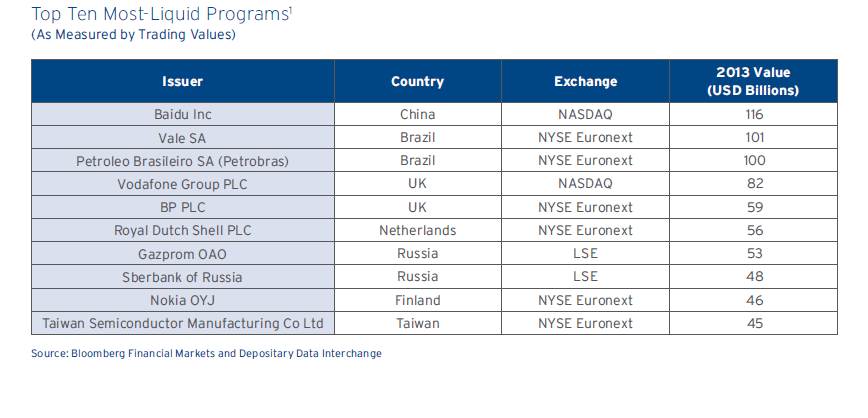
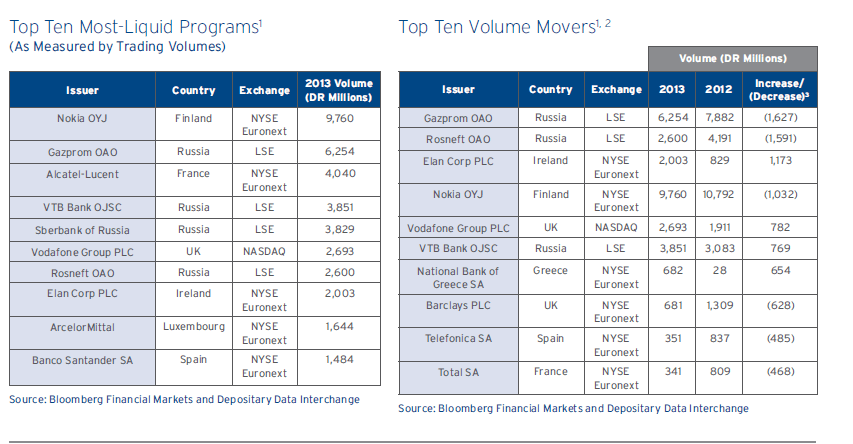
The table below shows the top 10 most-liquid DR programs from EMEA in 2013 by trading volumes:

Top 10 Most Liquid DRs - EMEA-2

The table below shows the top 10 most-liquid DR programs from Latin America in 2013 by trading volumes:
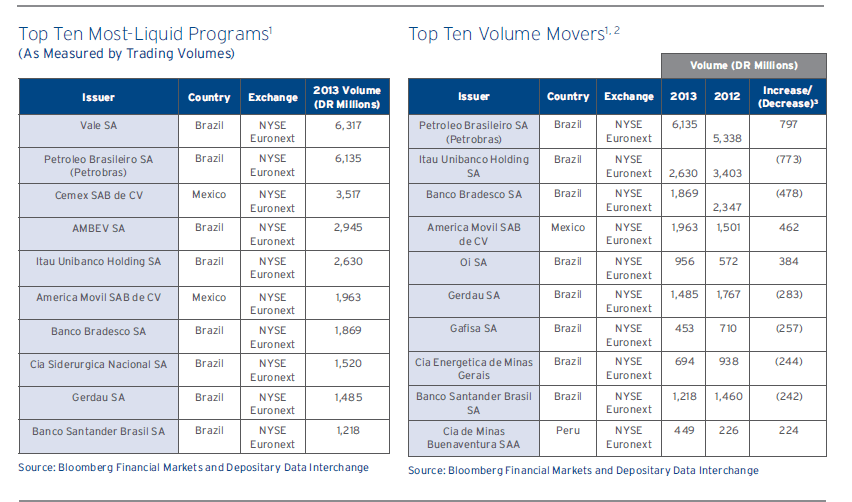
Top 10 Most Liquid DRs - Latin America-3


Notes:

1. Data as of December 15, 2013.
2. Absolute change in DR trading volume/values.
3. Differences may not sum to total due to rounding.

Source: Citi 

LSE on the above tables refers to the London Stock Exchange while the others are US markets.Latin American ADR trading volume is dominated Mexican and Brazilian stocks with the exception of Compañía de Minas Buenaventura S.A.A (BVN) from Peru.

Disclosure: Long SAN, BBD, ITUB and PBR

The Top 10 Most-Liquid DR Programs 2013

Citi Depository Receipt Services recently its annual “Depositary Receipt Services Year-End 2013 Report” which has many interesting facts.

The table below shows the top 10 most-liquid DR programs in 2013 by trading volumes:

Click to enlarge

Top 10 Most-Liquid DR Programs by Volumes


The table below shows the top 10 most-liquid DR programs in 2013 by trading values:

Top 10 Most-Liquid DR Programs by Values


Notes:

1. Data as of December 15, 2013.
2. Absolute change in DR trading volume/values.
3. Differences may not sum to total due to rounding.

Source: Citi 

Global DR trading volume remained flat last year relative to 2012 with the EMEA region contributing more than half of trade volumes followed by Latin America and Asia.

LSE on the above tables refers to the London Stock Exchange while the other two are US exchanges.

Disclosure: Long Petrobras

Panic Selling Has A High Cost

Most equity markets worldwide are down so far this year. The big sell-off in January was followed by another fall in the US markets yesterday. The S&P 500 is already off 5.76% year-to-date.Other major developed markets are also in the negative territory this year. For example, the broad market indices tracked by S&P 500 for Germany, France and Canada were off by over 4% in January alone.

Relative to developed markets, emerging markets have performed even worse. Plunging currencies in Argentina, Russia, Hungary, Turkey, Indonesia, etc. have revived fears of an emerging market meltdown. As a result, emerging stocks are having another bad year after last year’s poor performance.

Volatility is back with a vengence as triple digit losses for the Dow and S&P are occurring more frequently.In light of the high losses year-to-date in both emerging and developed markets and the tremendous volatility almost on a daily basis some investors may be thinking of dumping their equity holdings and moving to cash or other safe-haven assets now. But it is not wise to panic and liquidate stocks at current levels. While it is hard not to follow the herd and sell, panic selling has a high cost. When markets are so volatile investors should stay calm and stay disciplined and focus on their long-term goals. Emerging markets such as Turkey, Hungary, Indonesia, South Africa, etc. are not significant enough to topple the global economic recovery. Though the media may portray Turkey and Argentina as the villains for starting the current crisis, these countries are unlikely to trigger the next global financial crisis anytime soon.

With that in mind lets discuss some of the effects of panic selling. According to an article by Tom Elliott of J.P. Morgan Asset Management, the cost of panicking can be high. The chart below shows the annual returns of the MSCI Europe Index in the grey bars and the little diamonds for each bar shows the calendar year high and low for that year as percentage returns from Jan 1st.

Click to enlarge

MSCI-Europe-Annual-Returns-Highs-Lows

Source: The cost of panic, Tom Elliott, J.P. Morgan Asset Management, UK

The difference between max gain and max loss for a year is significant. Hence it is better for investors to ride out the volatility as opposed to trying to time the market.

Another important factor to note is the high risk of realizing losses at the end the year in years when the market is down. This is because the chances of the market rising sharply in the year following a down year are quite high as shown in the chart above. So an investor that sells out all his equities in a down year and shifts to cash or gold will lose out the potential big gains the following year.

Similarly the chart below shows the largest declines in the S&P 500 since the March 2009 lows during the global financial crisis:

SP500-Largest-Declines-Since-March-2009

Source: Flight to Safety Hasn’t Left Gate, The Wall Street Journal, Jan 27, 2014

Following the same logic related to the first chart above, here too the market recovered after every decline.Investors who sold at the lows during the periods shown would have missed the run up that followed.

In summary, the main takeaway from this article is not to panic-sell during volatile market conditions. Instead one should ride out the storm and can even try to pick up high quality stocks at cheaper prices.

Related ETFs:

  • iShares MSCI Emerging Markets Index Fund (EEM
  • Vanguard Emerging Markets ETF (VWO)
  • SPDR S&P 500 ETF (SPY)
  • SPDR STOXX Europe 50 ETF (FEU)

Disclosure: No Positions

The Transformation of Latin America 1993-2013

Latin American countries have made substantial progress over the past two decades or so. For the most part Brazil and other countries used their wealth from commodity exports to improve infrastructure, uplift their population out of poverty and other social causes.

The infographic below shows the transformation of Latin America as a whole over the past 20 years using select factors:

Click to enlarge

Eng-TheSignsofChange

Source: Latin Trade

The Top Five Banks in Chile

The top five banks in Chile based on Tier 1 Capital ratio as of the end of 2012 are shown below:

Click to enlarge

The-top-five-banks-in-Chile

Source: The Banker

Banco Santander Chile (BSAC) was the top bank in the ranking followed by Banco de Chile (BCH). These banks currently have dividend yields of 3.80% and 4.40%. Corbanca(BCA) has an yield of over 2.00% and is expected to be sold to some other major bank.

Disclosure: Long BCA,BSAC and BCH