Diversification Can Protect Against Large Losses

I have written many times before on the benefits of diversification. A well-built portfolio comprising of various asset classes and types can withstand adverse market conditions including brutal bear markets like the one we witnessed with the global financial crisis of 2008-2009.

According to a research report from Vanguard, broad market diversification cannot insure large losses but it can help to guard against unnecessary large losses. Professional and retail alike can easily be caught off-guard with events beyond their control leading to the complete wipeout of an investment. An example of such an event is accounting fraud that triggered the collapse of Enron.

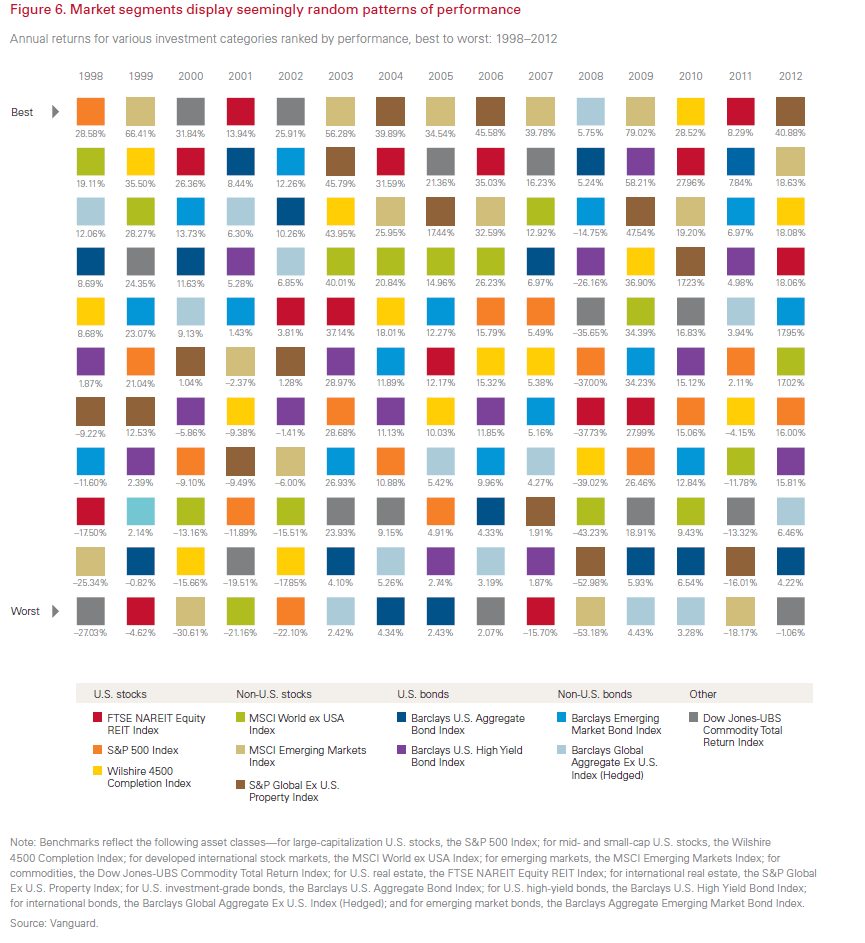
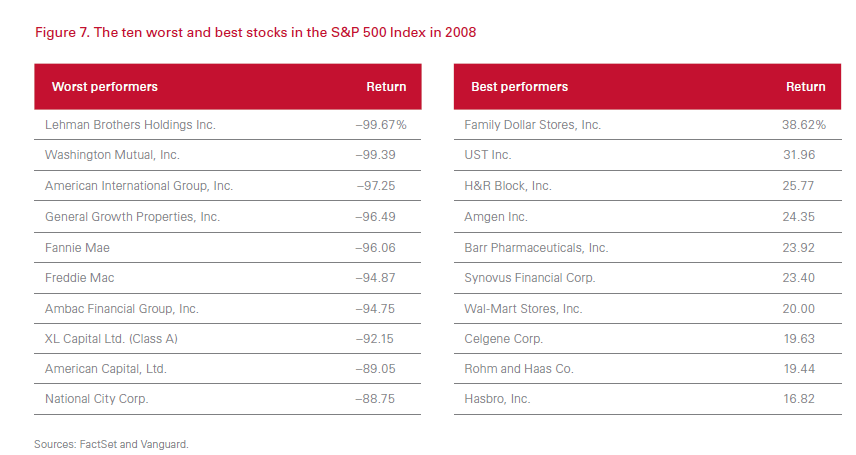
The chart below shows the best and worst performers in the S&P 500 index in 2008:

Click to enlarge

Best and Worst Performers in SP500 in 2008

Source: Vanguard’s Principles for Investing Success, Vanguard

In 2008, the S&P 500 had a negative return of 37%. But more a third of stocks in the index fell over 50%. Companies such as Lehman, Wamu, AIG, etc. as shown above crashed dramatically and some of them disappeared altogether. One such case was the Cleveland,OH-based National City Bank which collapsed and was taken over by The PNC Financial Services Group, Inc (PNC) with help from the Feds. National City investors including myself ended up owning PNC stock by this disaster. Most of these worst performers were once “blue chip” companies in the financial sector and were paying solid dividends and were considered “safe” long-term investments. Obviously that assumption turned to be utter and complete false to say the least.

On the other hand, the same year saw the stocks of boring companies such as Wal-Mart, Family Dollar Stores, Hasbro, etc. rise by double digits.

The moral of the story here is that the benefits of diversification cannot be under stated. Seemingly safe and well-run firms may blow up for any number of reasons beyond an investor’s control who are basically “outsiders” trying to look in and discern the condition of a company.

Disclosure: Long PNC

What Drives Long-Term Return – Dividends or Multiple Expansion?

The return on an equity investment can be grouped into two parts: dividend return and price return. Dividend return is based on dividend yield and dividend growth. While dividend yield is important dividend growth is even more important especially for investments held over many years since returns are boosted due to the effect of compounding. One way stock prices increase is via multiple expansions. The P/E ratio of an equity will rise higher as investors are willing to pay more per share for the same amount of earnings. Dividend yields and dividend growth can be considered as somewhat stable and predictable compared to multiple expansions which tend to expand or contract based on the overall market or investor attraction towards a particular sector. For example, during bull markets stock multiples can go sky-high as investors get caught in the frenzy of rising stock prices and focus less on fundamentals. Hence multiple expansions are at the whim of the market. It would be unwise to invest in stocks purely betting on price appreciation which may or may not occur.

Of course, dividends are also not guaranteed as they can be reduced, suspended or even eliminated for any number of reasons. But generally high-quality established firms tend to not only pay stable dividends but also raise them on a consistent basis. There are companies that have increased dividends every year for many years.

For investors wondering whether dividends or multiple expansions drive long-term returns, research by GMO has found that dividends indeed drive long-term returns. From an article by Stuart Reeve, Andrew Wheatley-Hubbard & James Bristow of Blackrock:

Dividend yield and dividend growth have accounted for approximately 90% of long-term stock returns,much more than multiple expansion and valuation moves.

Click to enlarge

Global Dividends vs Multiple Growth Long term

Source: Why Dividends? Why Global? , Why Now? Why Always?, BlackRock

Over the four decades noted, multiple expansion accounted for just 1.1% of the average annual returns for U.S. equities. Dividends generated most of the average annual returns with dividend growth accounting for more than dividend yield. Australian equities’ multiples actually declined but the dividend yield and dividend growth was substantial enough to push annual returns to about 12%. In UK, France and Germany multiple expansion was basically flat or went negative, but still all the three markets had decent positive returns because of dividends. Similarly the multiples of Canadian stocks barely moved. However average annual returns was good for Canadian stocks also.

Ten large-cap high-quality stocks are listed below to consider for long-term investment:

1.Company: Nestle SA (NSRGY)
Current Dividend Yield: 3.30%
Sector: Food Products
Country: Switzerland

2.Company: Unilever PLC (UL)
Current Dividend Yield: 3.62%
Sector: Food Products
Country: UK

3.Company:Colgate-Palmolive Co (CL)
Current Dividend Yield: 2.27%
Sector: Household Products
Country: USA

4.Company:Procter & Gamble Co (PG)
Current Dividend Yield: 3.09%
Sector: Household Products
Country: USA

5.Company: The Coca-Cola Co (KO)
Current Dividend Yield: 3.17%
Sector:Beverages
Country: USA

6.Company: Henkel AG & Co KGaA (HENKY)
Current Dividend Yield: 1.72%
Sector: Household Products
Country: Germany

7.Company: National Australia Bank Ltd (NABZY)
Current Dividend Yield: 5.49%
Sector:Banking
Country: Australia

8.Company: Royal Bank of Canada (RY)
Current Dividend Yield: 3.93%
Sector: Banking
Country: Canada

9.Company: Abbott Laboratories(ABT)
Current Dividend Yield: 2.29%
Sector: Pharmaceuticals
Country: USA

10.Company:Air Liquide (AIQUY)
Current Dividend Yield: 2.42%
Sector: Chemicals
Country: France

Note: Dividend yields noted above are as of Mar 21, 2014. Data is known to be accurate from sources used.Please use your own due diligence before making any investment decisions.

Disclosure: No HENKY, RY

Winners and Losers From Lower Oil Prices

Crude oil (Brent) futures rose gain on Friday at NYMEX and closed at $106.92  for May delivery. Gasoline prices have also followed the upward march this year and currently the average U.S. price stands at $3.51 according to Gas Buddy site.Due to geopolitical risks and other factors oil prices continue to go higher and may stay in the $100+ range this year.

What if oil prices were to fall? Which countries are likely to benefit from lower oil prices?

The following chart shows the winners and losers from lower prices:

Click to enlarge

Low oil price winners and losers

Source: Commodity Themes In 2014, Deutsche Bank

According to Deutsche Bank, lower crude oil prices would hurt the big petroleum exporters while big importers would gain.The big oil exporters such as Venezuela, Russia, Colombia, Mexico and Malaysia will the losers. Malaysia became a net oil exporter due to the discovery of oil fields offshore. Colombia’s Ecopetrol(EC) has had an explosive grown in the past few years as it pumps out more barrel per day.

Lower oil prices would help economic growth especially the major oil importing countries like India, China, Thailand, etc. Deutsche Bank estimated that a $10 drop in oil prices would increase economic growth in Europe by 0.5 percent and in Asia by 0.8 percentage points.

Disclosure; No Positions

Updates:

Falling oil prices: Who are the winners and losers?, Dec 16, 2014, BBC

A Brief Overview of the Healthcare System in China

China has the world’s largest population. As a developing country undergoing dramatic changes in the past few decades healthcare is one sector that is vastly under developed and offer plenty of potential for growth. Healthcare is especially interesting since millions of rural people move into large urban cities and their lifestyles change. So in this post lets take a brief look at China’s healthcare system.

China’s healthcare expenditure as a percentage of GDP is much lower than most OECD countries as shown in the chart below:

Click to enlarge

China vs World Heathcare Exp as a percent of GDP

Source: China: Themes and Strategy for 2014, Deutsche Bank

Brazil spends more than China on healthcare. But the U.S. spends the most among OECD countries. The US ratio of healthcare expenditure to  GDP is more than three times that China’s. Though the U.S. population is much smaller than China’s, US  healthcare expenditure is so high because of waste, regulations and other factors.

The following are some of the key points from the Deutsche Bank research report:

  • Total healthcare expenditure in China rose at an annual average rate of 18% between 2008 and 2012.
  • Healthcare system is China is majority owned and operated by the state. Private sector providers such as hospitals and clinics account for only 14% of hospital beds and serve less than 10% of patients nationwide.
  • While the demand for healthcare services surges the supply of doctors is inadequate. As of 2012, China had 1.8 doctors per 100 people compared to 2 to 4.3 in OECD countries.

Click to enlarge

Number of doctors by country


  • With the Healthcare Reform Plan released in 2012, China targets 20% of hospital beds and services to be provided by private sector from the current 14%.
  • As noted earlier, the state provides the majority of healthcare services in China. Private sector accounts for only a small percentage of the patients served since strict regulations exist on the growth of private hospital into large scale providers. Much of the private hospitals today in the country are small and provide specialized services. The chart below shows international comparison of healthcare services ownership:

Healthcare ownersip by country

In the U.S. the healthcare industry is dominated by private players with the state basically regulating the market.The 15% public ownership shown is due to Medicare, Medicaid, Veterans Affairs (VA) hospitals, etc. which are all publicly funded.