Diversification among asset classes is one of the simplest and easiest ways to reduce risk and increase stability to a portfolio. As no one asset class can top the returns every year it is important to diversify. The following chart shows the returns of various asset classes from 2002 to 2021. Large-cap US growth stocks were the winners with an annualized return of around 11%.
Click to enlarge
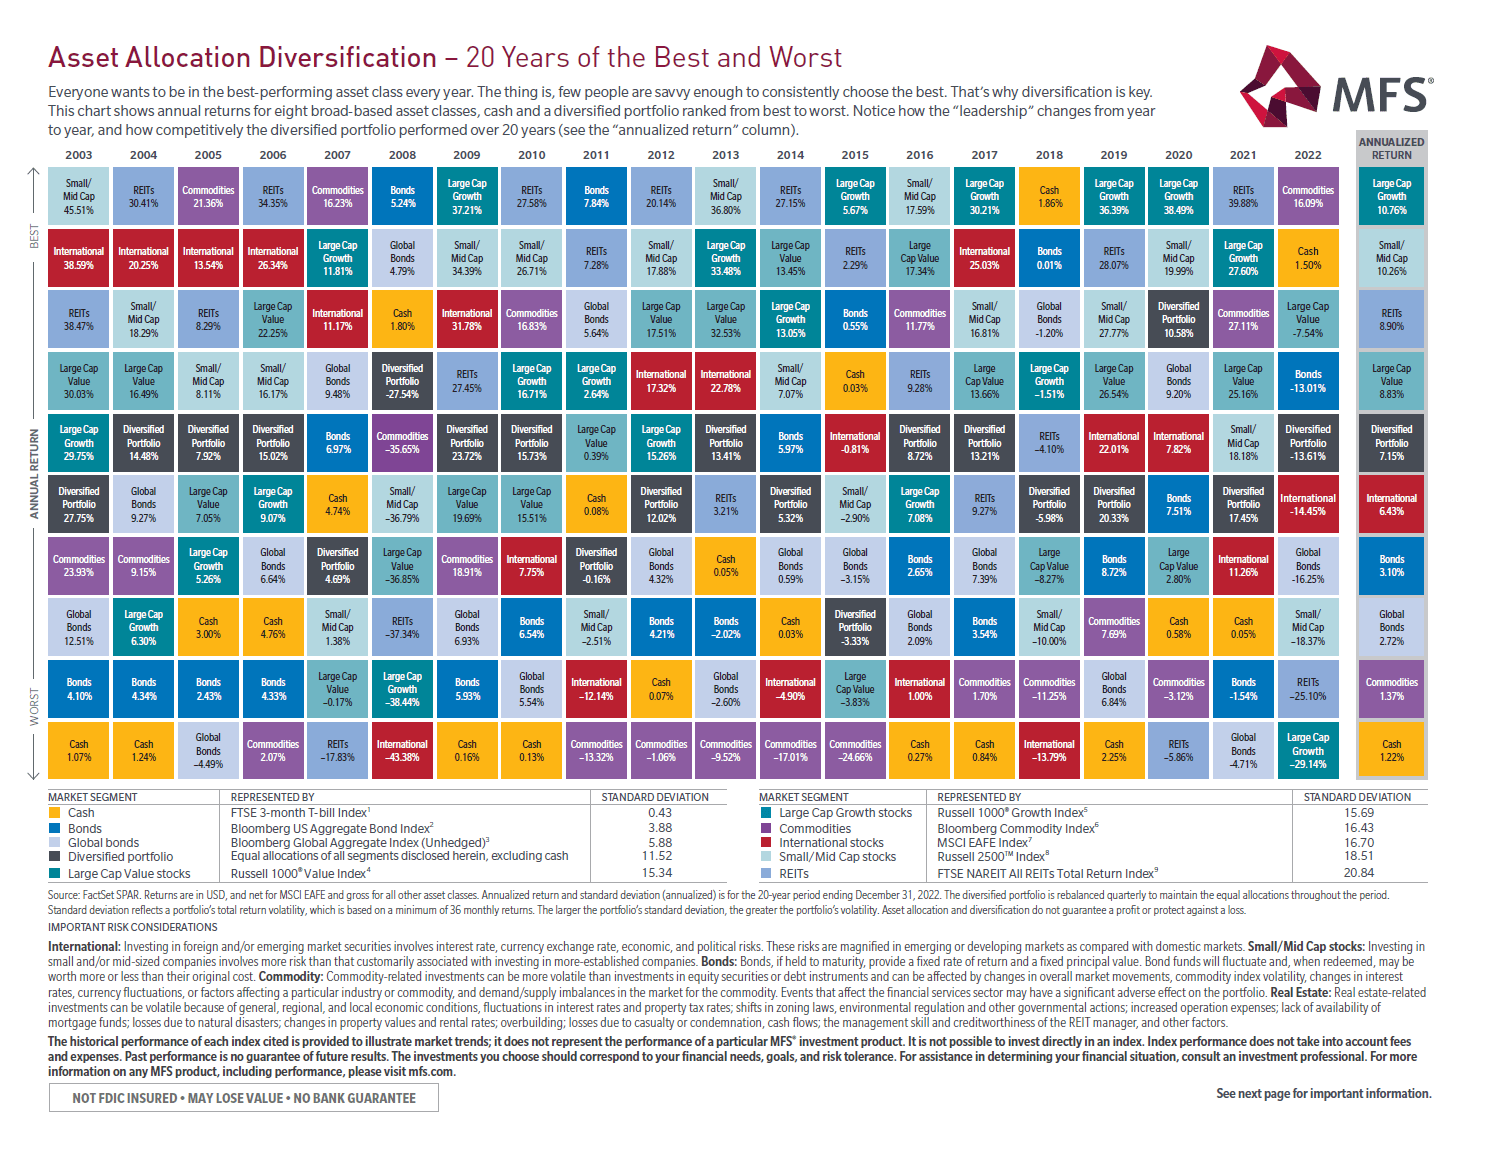
Source: MFS
Related ETFs:
- SPDR S&P 500 ETF (SPY)
- Vanguard S&P 500 ETF (VOO)
- iShares TIPS Bond ETF (TIP)
- iShares iBoxx $ Investment Grade Corporate Bond ETF (LQD)
- iShares Core Total U.S. Bond Market ETF (HYG)
- SPDR® Barclays High Yield Bond ETF (JNK)
Disclosure: No positions