On The Dividend Payout Ratios Of U.S. Stocks

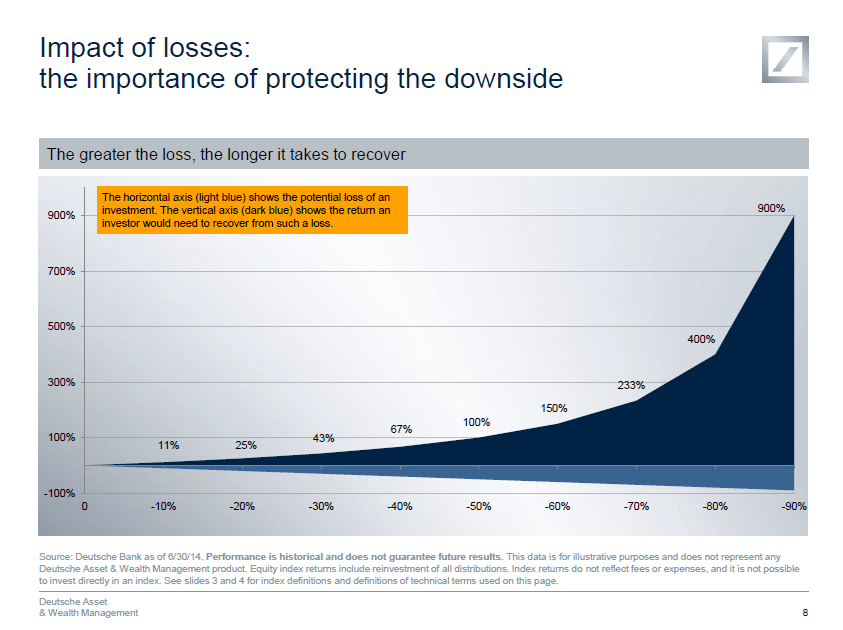
The current dividend yield of the S&P 500 is 1.91%. It has stayed around the 2% mark for many years. Despite corporate profits soaring and reaching record-high levels most U.S. companies have not shared the higher earnings with their shareholders in  the form of higher dividend payouts.

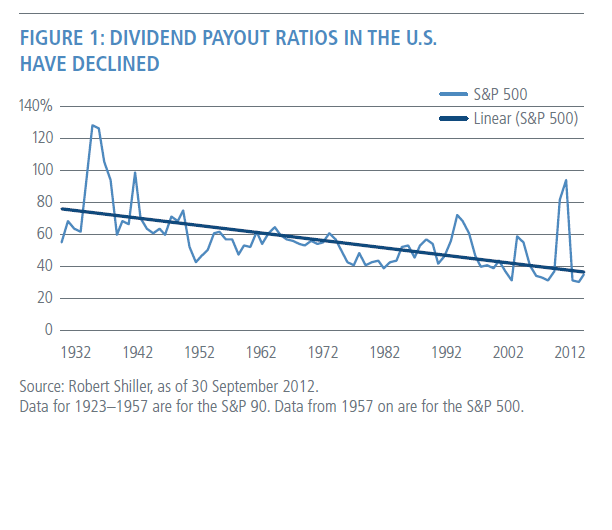
The chart below shows the long-term declining trend of dividend payout ratio in the U.S.:

Click to enlarge

US Dividend Payout Ratio chart

Source: Going Global Can Pay Dividends, PIMCO, December 2013

The takeaway here is that investors should not assume that higher profits will automatically lead to higher dividend payouts. This is especially true with U.S. firms. Hence investors should plan investment strategies accordingly. Some of the reasons for the low dividend payout ratios include: cultural change in the past few decades when stock prices soared and investors ignored dividends, many corporate management having crazy dreams of growing big by acquisitions, ability to “play” with companies’ retained earnings to manipulate stock prices via share buybacks, powerless mom&pop retail investors, docile big investors such as mutual funds and others, tax policies, etc. All these have contributed to this sad state of affairs of the U.S. corporate world. This situation is unlikely to change in the foreseeable future.

Related ETFs:

  • iShares Dow Jones Select Dividend ETF (DVY)
  • SPDR S&P Dividend ETF (SDY)
  • Vanguard Dividend Appreciation ETF (VIG)
  • Vanguard High Dividend Yield ETF (VYM)

Dislosure: No Postions

RIA NovostiThe History of the Atomic Bomb Project

13:35 29/08/2014 The first Soviet nuclear warhead was tested on August 29, 1949.>>

Why Cutting Down Losses Is Important

The S&P 500 has more than doubled from the low reached during the global financial crisis. However some investors’ portfolios may still not have recovered fully because some individual stocks they own may still be down from the highs reached before the crisis. Hence cutting down losses on an investment is important. Waiting for a stock that has fallen hard to recover may not be always be the wise strategy especially if the stock shows no signs of uptrend even after many years. So in such cases it is better to take the losses and move on. For example, lets consider a hypothetical $10 stock that falls 90% . In order for an investor to recoup their original investment, the stock has to rise to $1 to $10 (or) to put it in another way it has to rise by 900% which is huge. This stock may take many years to get back to even. So the greater the loss the longer it takes to recover. This simple concept is very important to understand for ordinary investors. The following chart shows this concept figuratively:

Click to enlarge

Importance of Protecting Downside

Source: Source:  Managing risk factors to build a better portfolio, Deutsche Asset & Wealth Management

The World’s Top 100 Non-Financial TNCs Ranked by Foreign Assets

The Global Top 100 Non-Financial Trans-National Corporations (TNCs) ranked by Foreign Assets as of 2013 are

listed in the table below:

RankCorporationCountryIndustryForeign Assets (in Millions of dollars)Total Assets (in Millions of dollars)
1General Electric CoUnited StatesElectrical & electronic equipment331 160656 560
2Royal Dutch Shell plcUnited KingdomPetroleum expl./ref./distr.301 898357 512
3Toyota Motor CorporationJapanMotor vehicles274 380403 088
4Exxon Mobil CorporationUnited StatesPetroleum expl./ref./distr.231 033346 808
5Total SAFrancePetroleum expl./ref./distr.226 717238 870
6BP plcUnited KingdomPetroleum expl./ref./distr.202 899305 690
7Vodafone Group PlcUnited KingdomTelecommunications182 837202 763
8Volkswagen GroupGermanyMotor vehicles176 656446 555
9Chevron CorporationUnited StatesPetroleum expl./ref./distr.175 736253 753
10Eni SpAItalyPetroleum expl./ref./distr.141 021190 125
11Enel SpAItalyElectricity, gas and water140 396226 006
12Glencore Xstrata PLCSwitzerlandMining & quarrying135 080154 932
13Anheuser-Busch InBev NVBelgiumFood, beverages and tobacco134 549141 666
14EDF SAFranceUtilities (Electricity, gas and water)130 161353 574
15Nestlé SASwitzerlandFood, beverages and tobacco124 730129 969
16E.ON AGGermanyUtilities (Electricity, gas and water)124 429179 988
17GDF SuezFranceUtilities (Electricity, gas and water)121 402219 759
18Deutsche Telekom AGGermanyTelecommunications120 350162 671
19Apple Computer IncUnited StatesElectrical & electronic equipment119 918207 000
20Honda Motor Co LtdJapanMotor vehicles118 476151 965
21Mitsubishi CorporationJapanWholesale trade112 762148 752
22Siemens AGGermanyElectrical & electronic equipment110 462137 863
23ArcelorMittalLuxembourgMetal and metal products109 602112 308
24Iberdrola SASpainUtilities (Electricity, gas and water)108 679127 235
25Johnson & JohnsonUnited StatesPharmaceuticals96 803132 683
26Nissan Motor Co LtdJapanMotor vehicles95 228143 029
27Hutchison Whampoa LimitedHong Kong, ChinaDiversified91 436105 169
28Fiat S.p.A.ItalyMotor vehicles90 985119 474
29Pfizer IncUnited StatesPharmaceuticals90 403172 101
30BMW AGGermanyMotor vehicles88 370190 511
31Wal-Mart Stores IncUnited StatesRetail & Trade88 206204 751
32Daimler AGGermanyMotor vehicles87 257232 023
33Telefonica SASpainTelecommunications87 156163 654
34Mitsui & Co LtdJapanWholesale trade86 023107 016
35Ford Motor CompanyUnited StatesMotor vehicles79 092203 752
36CITIC GroupChinaDiversified78 602565 884
37Statoil ASANorwayPetroleum expl./ref./distr.78 185144 741
38Airbus Group NVFranceAircraft77 614128 474
39Novartis AGSwitzerlandPharmaceuticals71 941126 254
40Procter & Gamble CoUnited StatesDiversified70 981139 263
41Hon Hai Precision IndustriesTaiwan Province of ChinaElectrical & electronic equipment70 65977 089
42General Motors CoUnited StatesMotor vehicles70 074166 344
43Anglo American plcUnited KingdomMining & quarrying68 95571 165
44BHP Billiton Group LtdAustraliaMining & quarrying67 649139 178
45Repsol YPF SASpainPetroleum expl./ref./distr.66 01189 613
46International Business Machines CorporationUnited StatesElectrical & electronic equipment60 841126 223
47BASF SEGermanyChemicals58 32388 644
48Rio Tinto PLCUnited KingdomMining & quarrying58 059111 025
49Microsoft CorporationUnited StatesPrepackaged software57 087142 431
50Unilever PLCUnited KingdomDiversified55 76962 664
51BG Group plcUnited KingdomOil and gas field exploration55 02665 974
52Hewlett-Packard CoUnited StatesElectrical & electronic equipment54 548105 676
53ConocoPhillipsUnited StatesPetroleum expl./ref./distr.54 430118 057
54Compagnie de Saint-Gobain SAFranceNon-metallic mineral products53 70462 957
55SABMiller PLCUnited KingdomFood, beverages and tobacco53 33253 751
56OrangeFranceTelecommunications52 362118 178
57RWE AGGermanyUtilities (Electricity, gas and water)52 336111 688
58Roche GroupSwitzerlandPharmaceuticals50 83767 084
59Mondelez International, Inc.United StatesFood, beverages and tobacco50 83472 557
60Sumitomo CorporationJapanWholesale trade49 66284 326
61GlaxoSmithKline PLCUnited KingdomPharmaceuticals49 46069 403
62Petronas - Petroliam Nasional BhdMalaysiaPetroleum expl./ref./distr.49 072163 275
63AP Moller - Maersk A/SDenmarkTransport and storage48 73074 451
64SanofiFrancePharmaceuticals48 403132 266
65Vattenfall ABSwedenElectricity, gas and water47 66775 105
66Vale SABrazilMining & quarrying47 247124 289
67Samsung Electronics Co., Ltd.Korea, Republic ofElectrical & electronic equipment46 425203 671
68Schlumberger LtdUnited StatesOther consumer services45 50767 100
69Imperial Tobacco Group PLCUnited KingdomTobacco45 44445 872
70United Technologies CorporationUnited StatesAircraft44 78690 594
71Christian Dior SAFranceTextiles43 90871 981
72Tesco PLCUnited KingdomRetail & Trade43 48883 565
73China Ocean Shipping (Group) CompanyChinaTransport and storage43 45256 126
74Linde AGGermanyChemicals43 04845 090
75Sony CorporationJapanElectrical & electronic equipment42 239149 161
76British American Tobacco PLCUnited KingdomFood, beverages and tobacco41 94044 329
77Caterpillar IncUnited StatesConstruction41 52684 896
78Lafarge SAFranceNon-metallic mineral products41 48451 046
79Volvo ABSwedenMotor vehicles41 18553 242
80Google Inc.United StatesSoftware40 916110 920
81Renault SAFranceMotor vehicles40 866103 252
82Marubeni CorporationJapanWholesale trade40 67770 578
83ABB Ltd.SwitzerlandEngineerig services39 89348 064
84AstraZeneca PLCUnited KingdomPharmaceuticals39 70055 899
85Liberty Global plcUnited KingdomTelecommunications38 12967 714
86Carrefour SAFranceRetail & Trade37 91359 981
87OMV AGAustriaPetroleum expl./ref./distr.37 28243 765
88ITOCHU CorporationJapanWholesale trade37 07576 347
89Barrick Gold CorporationCanadaGold mining36 91137 448
90The Coca-Cola CompanyUnited StatesFood, beverages and tobacco36 86090 055
91CargillUnited StatesFood35 92859 880
92Pepsico IncUnited StatesFood, beverages and tobacco35 86377 478
93WPP PLCUnited KingdomBusiness services35 64941 236
94Deutsche Post AGGermanyTransport and storage35 48948 848
95Merck & CoUnited StatesPharmaceuticals34 552105 645
96Diageo PLCUnited KingdomFood, beverages and tobacco34 43138 157
97Teva Pharmaceutical Industries LimitedIsraelPharmaceuticals34 37647 508
98China National Offshore Oil CorpChinaPetroleum expl./ref./distr.34 276129 834
99Japan Tobacco IncJapanFood, beverages and tobacco34 05444 858
100Koninklijke Philips Electronics NVNetherlandsElectrical & electronic equipment33 90136 568

Source: UNCTAD

Download Lists:

  1. The Global Top 100 Non-Financial Trans-National Corporations (TNCs) (in Excel format)
  2. The Global Top 100 TNCs from Emerging and Frontier Markets (in Excel format)

Related:

From a potential investment perspective investors can consider the following ten stocks for further research:

1.Company: Johnson & Johnson (JNJ)
Current Dividend Yield: 2.68%
Country: USA

2.Company: Nestle SA (NSRGY)
Current Dividend Yield: 3.19%
Country: Switzerland

3.Company: Diageo PLC (DEO)
Current Dividend Yield: 2.89%
Country: UK

4.Company: Vodafone Group PLC (VOD)
Current Dividend Yield: 7.10%
Country: UK

5.Company: British American Tobacco PLC (BTI)
Current Dividend Yield: 4.15%
Country: UK

6.Company: Total SA (TOT)
Current Dividend Yield: 5.05%
Country: France

7.Company: BASF SE (BASFY)
Current Dividend Yield: 3.77%
Country: Germany

8.Company: Novartis AG (NVS)
Current Dividend Yield: 2.94%
Country: Switzerland

9.Company: Unilever PLC (UL)
Current Dividend Yield: 3.45%
Country: UK

10.Company: Teva Pharmaceutical Industries Limited (TEVA)
Current Dividend Yield: 2.62%
Country: Israel

Note: Dividend yields noted above are as of Sept 15, 2014. Data is known to be accurate from sources used. Please use your own due diligence before making any investment decisions.

Disclosure: No Positions

The Global Top Oil and Gas Companies by Market Capitalization

The oil and gas industry is the one of the most important industries in many countries. The economies of Middle Eastern countries are based oil and natural gas. It is also the largest sector of the Russian economy. As a commodity, crude oil prices are volatile and fluctuate based on an infinite number of reasons ranging from political to supply and demand. For example, a bunch of rag tag rebels in Nigeria setting fire to a pipeline can cause the global price of oil to shoot up. If wars, rebels and other factors do not inflate the price of oil then the OPEC cartel has the power to adjust the production and supply there by leading to higher prices.

In recent weeks crude oil prices have actually fallen. From over $100 a barrel oil prices (WTI) has plunged and closed last Friday at $91.13 on the NYMEX. As falling prices dings the revenues of the cartel members. OPEC has indicated that it would intervene if prices fall below $85 per barrel.If oil price falls below that set level, then OPEC will manipulate the production levels to prop up the price back to above $85.

From an investment standpoint, large-cap oil and gas companies offer many advantages such long-term growth, stable and decent dividend yields,  higher earnings when oil prices rise, etc. Hence investors can consider allocating a portion of their portfolios to oil and gas stocks.

The following 14 global oil and gas giants appeared in the Global Top 100 Companies by Market Capitalization report published by PricewaterhouseCoopers earlier this year. Investors looking to gain exposure to this industry can consider adding these companies in  a phased manner.

1.Company: Exxon Mobil Corp (XOM)
Current Dividend Yield: 2.88%
Country: USA

2.Company: Royal Dutch Shell PLC (RDS.A)
Current Dividend Yield: 4.22%
Country: UK

3.Company: PetroChina Co Ltd (PTR)
Current Dividend Yield: 3.46%
Country: China

4.Company: Chevron Corp (CVX)
Current Dividend Yield: 3.49%
Country: USA

5.Company: BP PLC (BP)
Current Dividend Yield: 5.09%
Country: UK

6.Company: Total SA (TOT)
Current Dividend Yield: 5.34%
Country: France

7.Company: Schlumberger NV (SLB)
Current Dividend Yield: 1.57%
Country: USA

8.Company: Sinopec Corp (SNP)
Current Dividend Yield: 3.50%
Country: China

9.Company: Gazprom OAO (OGZPY)
Current Dividend Yield: 5.43%
Country: Russia

10.Company: Petrobras SA (PBR)
Current Dividend Yield: 2.96%
Country: Brazil

11.Company: Eni SpA (E)
Current Dividend Yield: 4.71%
Country: Italy

12.Company: Statoil ASA (STO)
Current Dividend Yield: 4.22%
Country: Norway

13.Company: Ecopetrol SA (EC)
Current Dividend Yield: 6.92%
Country: Colombia

14.Company: ConocoPhillips (COP)
Current Dividend Yield: 3.72%
Country: USA

Note: Dividend yields noted above are as of Sept 12, 2014. Data is known to be accurate from sources used.Please use your own due diligence before making any investment decisions.

Disclosure: Long PBR

A Note on Currency Risk in International Equity Investments

Investing in foreign stocks involves many risks one of which is currency risk. While most currencies of developed countries remain stable  in relation to the US dollar there is still the risk that currency exchange movements can reduce returns earned from equities. Unlike emerging or frontier markets investors in developed countries need not worry about dramatic devaluation almost overnight or other extreme scenarios.

Lets review the impact of currency risks using the MSCI EAFE Index which measures the performance of developed equities outside of the U.S. and Canada. The iShares MSCI EAFE Index (EFA) ETF tracks the performance of this index and has net assets of over $54.0 billion. It is one of the largest ETFs out there in terms of assets as it provides a simply way to access developed markets outside of U.S. and Canada.Investors in this ETF and other funds that track the index will be exposed to many currencies such as the Swedish Krona, Japanese Yen,  Euro, Australian dollar, etc. For the 22 countries in the index investors will be exposed to 12 different currencies risks as shown in the graphic below:

Click to enlarge

MSCI Currency Exposure by Country

Currency exchange movements affect the total return on an investment in foreign equities. In some years this impact can be significant when compare to equity returns. The following chart shows the contribution of currency effects to the MSCI EAFE Index by year from 1983 to 2013:

Contribution of Currency Effects to MSCi EAFE Returns 1983 to 2013


Source:  Managing risk factors to build a better portfolio, Deutsche Asset & Wealth Management

Related ETFs:

  • Vanguard MSCI EAFE ETF (VEA)
  • iShares MSCI EAFE Index (EFA)

Disclosure: No Positions

Test:

RIA NovostiThe History of the Atomic Bomb Project

13:35 29/08/2014 The first Soviet nuclear warhead was tested on August 29, 1949.>>