Why Own Global Stocks With High Dividend Payout Ratios

Investors looking for dividend income from equities must consider adding foreign stocks. Going overseas not only provides potentially higher dividends but also other benefits such as diversification, higher capital growth potential, etc. As I have mentioned many times before the dividend yield of the S&P 500 is around 2%. This rate is low compared to many foreign equity markets.

Here is an interesting new perspective on global dividend stocks from a report by Thornburg Investment Management:

Perspectives on dividends vary between cultures. Among many U.S.-domiciled companies, where executive compensation is tied to growing the share price,dividends are a sign of limited reinvestment opportunities. Arnott and Asness (2003) showed, however, that companies with high dividend payout ratios tend to subsequently have higher earnings growth than companies with lower payout ratios, and that the higher earnings growth may be due to better allocation of capital. This view of dividend payout is more prevalent outside the United States, where payment of high and growing dividends is viewed as a sign of financial strength. A comparison of dividend yields among countries illustrates this cultural difference (Figure 1).

Click to enlarge

Dividend Yields by Country


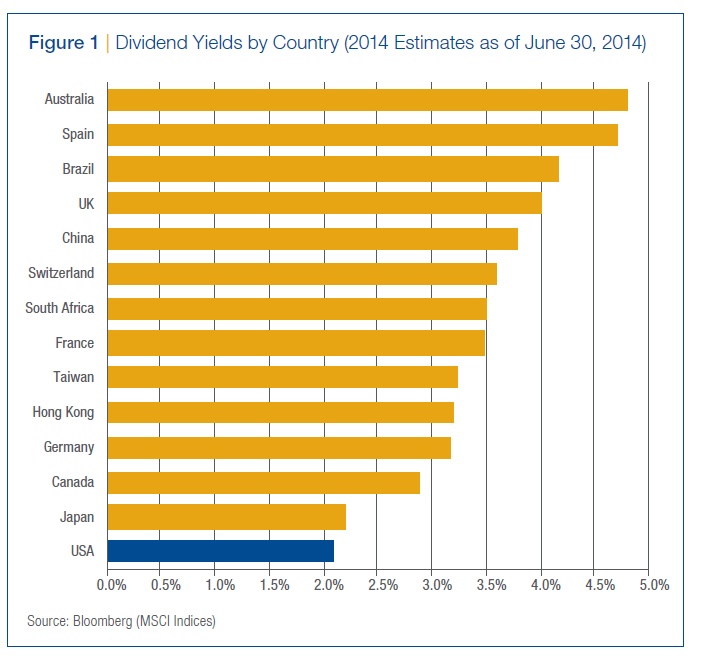
Source: Investing in Retirement Using a Global Dividend Income Strategy, Thornburg Investment Management, August 2014

The Arnott and Asness study from 2003 showing that companies with high dividend payout ratios tend to subsequently have higher earnings growth than companies with lower payout ratios is fascinating. The following is the abstract from their research paper:

We investigate whether dividend policy, as observed in the payout ratio of the U.S. equity market portfolio, forecasts future aggregate earnings growth. The historical evidence strongly suggests that expected future earnings growth is fastest when current payout ratios are high and slowest when payout ratios are low. This relationship is not subsumed by other factors, such as simple mean reversion in earnings. Our evidence thus contradicts the views of many who believe that substantial reinvestment of retained earnings will fuel faster future earnings growth. Rather, it is consistent with anecdotal tales about managers signaling their earnings expectations through dividends or engaging, at times, in inefficient empire building. Our findings offer a challenge to market observers who see the low dividend payouts of recent times as a sign of strong future earnings to come.

Click to enlarge

Relationship between Payout Ratio and Earnings Growth

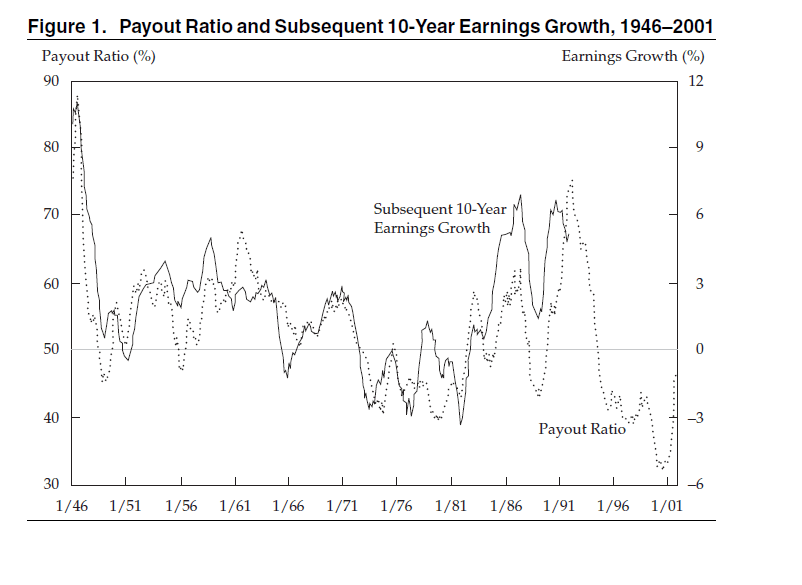
Source: Surprise! Higher Dividends = Higher Earnings Growth, Robert D. Arnott and Clifford S. Asness, 2003, AIMR

Hence it is a wise strategy to diversify one’s portfolio with high-quality dividend-paying stocks from foreign countries.

Ten international dividend opportunities are listed below with their current dividend yields for consideration:

1.Company: Westpac Banking Corp (WBK)
Current Dividend Yield: 5.72%
Sector:Banking
Country: Australia

2.Company: Banco Santander SA (SAN)
Current Dividend Yield: 8.92%
Sector: Banking
Country: Spain

3.Company: British American Tobacco PLC(BTI)
Current Dividend Yield: 4.35%
Sector: Tobacco
Country: UK

4.Company: Nestle SA (NSRGY)
Current Dividend Yield: 3.37%
Sector: Food Products
Country: Switzerland

5.Company:Taiwan Semiconductor Manufacturing Co Ltd (TSM)
Current Dividend Yield: 2.40%
Sector: Semiconductors & Semiconductor Equipment
Country:Taiwan

6.Company: Deutsche Telekom AG (DTEGY)
Current Dividend Yield: 4.62%
Sector:Telecom
Country:Germany

7.Company: Royal Bank of Canada (RY)
Current Dividend Yield: 3.75%
Sector: Banking
Country: Canada

8.Company: Orange (ORAN)
Current Dividend Yield: 6.62%
Sector: Telecom
Country: France

9.Company: Total SA (TOT)
Current Dividend Yield: 5.33%
Sector:Oil, Gas & Consumable Fuels
Country: France

10.Company: Telstra Corp Ltd (TLSYY)
Current Dividend Yield: 5.65%
Sector: Telecom
Country: Australia

Note: Dividend yields noted above are as of Oct 6, 2014. Data is known to be accurate from sources used.Please use your own due diligence before making any investment decisions.

Disclosure:Long RY, SAN

A Comparison of the Automobile Market in China and USA

China is one of the world’s leading market for auto manufacturers. As an emerging country with a population of over 1.3 billion the market is huge and the demand for cars from the growing middle-class is rising every year. As a result most of the world’s top auto makers have a presence in China.

According to a report in The Wall Street Journal earlier this year, 17.9 million passenger cars were sold in China last year. Consulting firm IHS expects sales to jump by 10% this year and 8% next year.

The following chart shows the total annual auto sales by year:

Click to enlarge

China Auto Sales by Year

Source: Car Makers Renew Efforts to Woo First-Time Buyers in China, The Wall Street Journal, April 18, 2014

The U.S. has a smaller population relative to China. With a population of over 316.0 million the market for cars is still large but saturated. While China had a sales volume of 17.9 million passenger cars in 2013, the sales of light vehicles reached 15.5 million in the U.S. according to Auto Alliance data. Light vehicles include cars and light trucks. This year the industry expects to sell over 16 million units. As of September total US sales has reached 12.4 million per WSJ data.

Click to enlarge

US_Sales 2007 to 2013

Historical US_Sales 2007 to 2013


Source: Auto Alliance

Though the total annual sales in China was higher than in the U.S. last year it does not tell the whole story. Despite the growing sales figures the auto penetration rate in China is much lower than in the U.S. and hence the growth potential is excellent in China. The two charts below from a presentation by emerging markets guru Dr.Mark Mobius illustrates this clearly:

Auto Penetration Rate in US, India and China

Auto Market Growth potential in China and India


Source:  Emerging Markets Outlook, Oktober 2013, Franklin Templeton Investments

It remains to be seen if the automobile boom in Communist China continues moving forward since the state is now trying to restrict car ownership in response to the growing pollution problem.

Some of the global auto makers with big market shares in China include Volkwagen AG(VLKAY), Ford Motor Co.(F), General Motors Company(GM), Honda Motor Co. Ltd (HMC), Toyota Motor Corporation(TM), etc.

Disclosure: No Positions

Some Reasons On Why The Italian Economy Remains Sluggish

Pisa TowerItaly has a population of about 61.0 million and is predominantly Catholic. Despite being a member of the EU and generally considered as a wealthy, the country’s economy has been mostly stagnant in the past few years. While the country has a great history and culture,  in modern times Italy hasn’t kept pace with the rest of the developed world mostly due to archaic laws, bureaucracy, corruption and resistance to change. The country is highly dividend with the Northern part being wealthy and the Southern part mostly middle-class. With the election of the young Matteo Renz as Prime Minister, it is about time that the country implements much needed political reforms and aim towards higher economic growth and prosperity for all.

A few interesting economic facts about Italy are listed below:

  1. Northern Italy is highly industrialized with many private firms while Southern Italy is is mostly agricultural-based and less-developed.
  2. Italy has a large underground economy which by some estimates account for about 17% of the GDP.
  3. The GDP size was about $1.80  in 2013 based on purchasing power parity.
  4. Nearly three-fourths of the economy is dominated by the services industry.
  5. Italy is a budget deficit country meaning the government’s expenditures exceed revenues.
  6. The top three export partners are Germany, France and the US. The top three import partners are Germany, France and China.
  7. Italy’s public debt is over €2.0 trillion (US$2.77 trillion) or 133% of GDP.
  8. According to the Bank of Italy, 98% of Italian companies employ fewer than 15 people.
  9. Entrepreneurs in Italy evade taxes considerably. In fact, they evade over 50% of the income they owe.
  10. Similarly people who live off investment income evade 80% of the taxes they owe according to Bank of Italy’s estimates.

Sources: The World Factbook, CIA & Can Italy Find Its Way? Resistance to Change Means Slow Recovery, The Wall Street Journal, April 29, 2014

An article in Der Spiegel yesterday summed up the problems Italy is currently facing. From the article:

The state in Italy is not the solution, but part of the problem. Because the state doesn’t work very well, work is becoming an increasingly rare commodity.

Why does a civil or business lawsuit take an average of 2,992 days in Italy, while 900 days suffice in Germany? Why do private citizens and entrepreneurs need to deal with about one hundred new tax laws every year — the statistical equivalent of two new laws per week? Why is the state refusing to pay the over €75 billion in outstanding bills from deliverers and contractors, thus pushing many people into ruin? Why are 16,000 administrators and 12,000 inspectors receiving regal salaries to lead thousands of publically-owned companies, most of which have nothing to do with public services and only create deficits?

Italy’s manufacturers’ association has calculated that €13 billion could be saved in the public sector alone. One egregious example stems from the national tourism agency, which commissioned a project to globally showcase Italy’s beauty by displaying seven photos around the world. After one and a half years, the seven photos were complete but because there wasn’t enough money left for the planned TV and online ads or posters, no potential tourist ever saw them: The budget of €5 million had been entirely used to pay the salaries of the people involved.

Source: Bungle Bungle: Italy’s Failed Economic Turnaround, Der Spiegel, Oct 6, 2014

In Italy, even the capital city of Rome seems to be in desperate need of a makeover. An article in the latest edition of Bloomberg BusinessWeek discusses the issues facing Rome though the eyes of a dedicated blogger. From the article:

The neighborhood in which Massimiliano Tonelli is walking is more than 100 years old, built in central Rome shortly after the unification of Italy. Monumental buildings rise around a central park, in the corner of which lie the ruins of an ancient Roman fountain. The Colosseum is a 15-minute walk away.

As the 35-year-old blogger ambles, he counts off the blemishes: cracks and pits in the sidewalk; walls plastered with posters and pamphlets; beer bottles lying around a garbage bin; cars illegally and dangerously parked; a man drying his laundry on a park bench. “The city is so beautiful, potentially,” he says. “It’s absurd that it be left like this.” He looks up at one of the 19th century buildings, its facade resplendent in the morning sun. “Rome is a city that’s only beautiful from 3 meters high and upwards.”

Source: Rome Blogger Exposes City Ravaged by Neglect, Bloomberg BusinessWeek, Oct 2, 2014

From an investment perspective, there are not many Italian firms that trade on the US exchanges. Just five Italian ADRs trade on the NYSE. So investors looking to gain exposure to Italy, can consider the iShares MSCI Italy Capped  ETF (EWI). It has an asset base of $1.2 billion and has 28 holdings. The fund is heavily concentrated with financials accounting for nearly 37% of the total.

Currently no closed-end fund exists for Italy on the US markets.

Disclosure: Long EWI

Related:

  1. Why Italy Will Not Make It (LSE)

Which German Firms Have High Exposure to Russia?

Germany has been reluctant in recent months to impose aggressive sanctions on Russia for its involvement in the Ukraine crisis. This is because unlike other developed countries including the U.S., Russia is an important trade partner for Germany. Many German companies have large investments in Russia and benefit from selling goods and services to Russia. In return, Russia is one of the major suppliers of oil and gas to Germany. So this mutual dependency is taken into account when German policy makers make their decisions.

From an article in The Local website:

Germany has been criticized for being reluctant to impose tough sanctions on Russia for its annexation of Crimea from Ukraine, as it is deemed an important trading partner.

But according to the German Foreign Office trade between the two countries declined by five per cent in 2013 to €76.5 billion – it was €80.5 billion in 2012.

German exports to Russia were worth €36.1 billion and German imports from Russia €40.4 billion.

That made Russia Germany’s eleventh biggest export market and seventh most important importer, according to Destatis.

Russia’s main exports to Germany were oil and natural gas, with around a third of German gas imports coming from the country.

Source: How important is Russia to Germany?, The Local, April 3, 2014

To answer this article title, the following German companies derive a significant amount of revenue from Russia. For example, Adidas has been in business during the days of the former Soviet Union and has over 1,000 stores today in Russia. It generated over 1.0 billion Euros $ in 2012 accounting for over 7% of total sales.

1.Company: adidas AG (ADDYY)
Current Dividend Yield: 2.80%
Sector:Textiles, Apparel & Luxury Goods

2.Company: Henkel AG & Co KGaA (HENKY)
Current Dividend Yield: 1.81%
Sector: Household Products

3.Company: BASF SE (BASFY)
Current Dividend Yield: 4.24%
Sector: Chemicals

4.Company: Siemens AG (SIEGY)
Current Dividend Yield: 3.54%
Sector:Industrial Conglomerates

5.Company: Volkswagen AG (VLKAY)
Current Dividend Yield: 2.78%
Sector: Auto Manufacturing

6.Company: Volkswagen AG (DDAIF)
Current Dividend Yield: 4.18%
Sector: Auto Manufacturing

7.Company: BMW AG (BAMXF)
Current Dividend Yield: 3.35%
Sector: Auto Manufacturing

8.Company: Beiersdorf AG (BDRFF)
Current Dividend Yield: 1.16%
Sector: Personal Care Products
Overview: Beiersdorf was founded in 1882 and had sales of over EUR 6.0 billion in 2012. The company’s stock is listed on the DAX since 2008. Its brand portfolio includes La Prairie,Nivea, Eucerin, Hansaplast, Labello, Florena, 8×4 and tesa.

Source: Corporate Germany Opposes Sanctions, The Wall Street Journal, May 2, 2014

Note: Dividend yields noted above are as of Oct 3, 2014. Data is known to be accurate from sources used.Please use your own due diligence before making any investment decisions.

Disclosure: Long HENKY

A Quick Post on Brazil

Brazilians are going to polls today. The current President Dilma Rousseff seems like will win again. From an investor’s point of view, Dilma has been a disaster when she was elected back in 2010 for the first term. If Dilma wins investors may have to brace themselves for another wild ride.

Here are a few interesting stats in terms of Brazilian equities:

  1. The benchmark Bovespa index is by nearly 15% in the past five years and year-to-date it is up by 8%.
  2. The iShares MSCI Brazil Capped ETF(EWZ) has lost 40% in the five years and is flat so flat so far this year.
  3. The state-owned oil company Petrobras (PBR) plunged 71% in 5 years.

Performance of iShares MSCI Brazil Capped ETF – 5 years:

Click to enlarge

EWG 5 Years

Source: Yahoo Finance

Year-to-date performance of Brazilian exchange-listed ADRs:

S.No.CompanyTickerYear-to-date change %Industry
1EmbraerERJ18.49%Aerospace & Defense
2BRF S.A.BRFS15.52%Food Producers
3Itau UnibancoITUB14.18%Banks
4Banco BradescoBBD13.09%Banks
5GolGOL9.63%Travel & Leisure
6Comp. Paranaense de Energia-COPEL ELP8.45%Electricity
7Banco Santander BrasilBSBR4.10%Banks
8Telefonica BrasilVIV1.98%Fixed Line Telecom.
9Petroleo Brasileiro-PetrobrasPBR1.38%Oil & Gas Producers
10Centrais Eletricas Brasileiras-EletrobrasEBRUNCHElectricity
11Banco Bradesco BBDO-0.43%Banks
12Companhia Energetica de Minas Gerais-CEMIGCIG-1.34%Electricity
13Companhia Brasileira de Distribuicao-CBDCBD-2.24%Food &Drug Retailers
14TIM ParticipacoesTSU-3.39%Mobile Telecom.
15CPFL EnergiaCPL-5.06%Electricity
16BrasilAgroLND-7.07%Real Estate Inv&Serv
17Fibria CeluloseFBR-7.79%Forestry & Paper
18AMBEV S.AABEV-10.75%Beverages
19UltraparUGP-14.63%Gas,H20&Multiutility
20BraskemBAK-24.37%Chemicals
21GafisaGFA-27.16%HouseGoods&HomeConst
22ValeVALE-27.74%Indust.Metals&Mining
23Companhia Energetica de Minas Gerais-CEMIGCIG-27.93%Electricity
24SABESPSBS-29.81%Gas,H20&Multiutility
25GerdauGGB-37.88%Indust.Metals&Mining
26Companhia Siderurgica Nacional-CSNSID-42.42%Indust.Metals&Mining
27OiOIBR-57.93%Fixed Line Telecom.

Source: BNY Mellon

The complete list of Brazilian ADRs trading on US exchanges and OTCs can be found here.

Disclosure: Long ITUB, BBD and PBR