How Much Did National Bank Of Greece Stock Fall In The Past 5 Years?

The equity market in Greece plunged last week. In just 3 days the benchmark index fell over 14% including 9% on Oct 15th. The Athens Stock Exchange General Index is down over 19% as of Oct 17. Greece was the main focus of the world a few years ago when the country’s economy  was on the verge of collapse during the sovereign debt crisis.However due to multiple bailouts over the years the country survived but many of the structural problems still linger in the background. So it is not surprising that the equity market can crash over 9% in one day.

National Bank Of Greece(NBG) is the only Greek ADR trading on the US exchanges. The stock is down a shocking 99.37% in the past 5 years according to data provided by Yahoo Finance.

Click to enlarge

National Bank of Greece Stock-5 Year Return

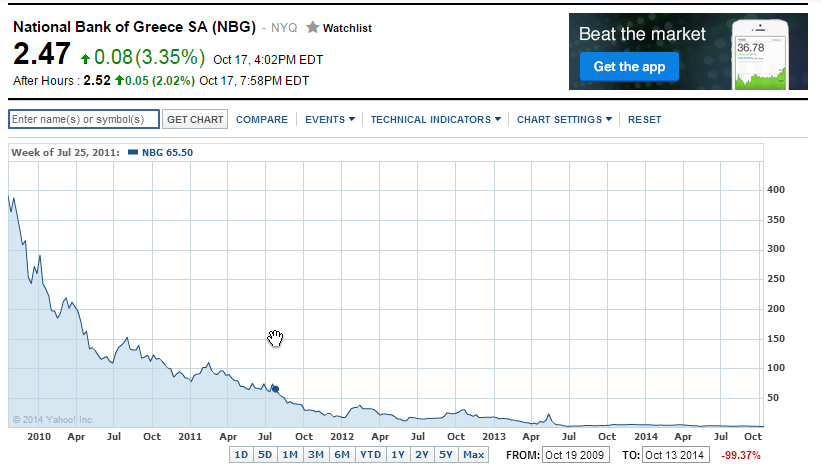
Source: Yahoo Finance

NBG is down over 56% year-to-date as of Oct 17th. The bank implemented a 10 for 1 reverse split in May 2013 and another 1 for 5 reverse split in 2011. Despite this the stock closed at $2.47 on Friday.

From an investment point of view, it is better to avoid investing in Greece until some of the fundamental problems are fixed.

Disclosure: No Positions

The Relationship Between S&P 500 Dividends and Dividend Payout Ratio

Corporate profits in the U.S. are at a record high.Accordingly earnings returned to shareholders in the form of dividends has also reached record levels. For example, the dividends on the S&P 500 as of September stood at $38.49.

Click to enlarge

US Corporate Profits


Source: Federal Reserve Bank of St. Louis

However as I have discussed before, the payout ratio of U.S. firms has not increased with increase in profits. In fact they have been declining for a few decades now. So even though companies are paying more in dividends but as a share of the total profits earned the amount paid out to investors is still low and they continue to hoard cash as retained earnings.

The chart below shows the rise in S&P 500 dividends and the dividend payout ratio from 1965 thru Sept, 2013:

Click to enlarge

S&P 500 dividends and dividend payout ratio chart

Source:  Will the pendulum swing toward a higher payout ratio?, Crawford Investment Counsel, November 2013

The key takeaway from this post is that just because a company earns higher profit it does not mean it will necessarily share that wealth with shareholders. This is especially true for retail investors who do not have the power to make changes in a company’s operations or management’s policies.

Related ETFs:

  • iShares Dow Jones Select Dividend ETF (DVY)
  • SPDR S&P Dividend ETF (SDY)
  • Vanguard Dividend Appreciation ETF (VIG)
  • Vanguard High Dividend Yield ETF (VYM)

Dislosure: No Postions

Which Frontier Markets Companies Are Multinationals ?

Up until a few decades ago the term “Multi-National Company” or MNC generally represented Western companies that were true multinationals and operated across the globe. In the recent decades, as emerging countries such as Brazil, Russia, India and China grew stronger economically some of firms from these countries emerged as the new emerging multinationals. A few of these multinationals include Petrobras (PBR) of Brazil, Gazprom(OGZPY) of Russia, Infosys (INFY) of India and China Petroleum & Chemical Corp.(SNP) of China.

Following the footsteps of emerging multinationals, some of the companies in frontier markets are also growing not only domestically but also expanding in markets outside of their home territories. These Frontier Markets Multinationals (FMMs) are have many advantages relative to their developed world peers according to an article by Tomás Guerrero, ESADE Business School in FT beyondbrics blog.

The table below shows the Top 10 Frontier Markets Multinationals (FMMs):

Click to enlarge

Frontier Market Multinationals

Source: Guest post: frontier market multinationals propel growth, FT beyondbrics, Oct 10, 2014

The author noted that the MSCI Frontier Markets Index rose by 26.3% in 2013 compared to the Emerging Markets Index which lost 2.6%.

As most of the frontier market firms do not trade on the US exchanges, one simple way to gain exposure to them is via the iShares MSCI Frontier 100 ETF (FM). Its 127 holdings includes companies such as Zain, Dangote, PetroVietnam, etc. noted in the table above.

The ETF has an asset base of over $786.0 million and the distribution yield as of Sept 30th is 4.69%. The expense ratio is 0.79%. Of the 16 countries represented in the fund, Kuwait, Nigeria and Argentina have the highest allocations.

Though the MSCI Frontier Markets 100 Index gained 26.33% last year, the returns in 2012 and 2011 were 8.60% and -18.63% respectively. While emerging markets performed poorly last year, developed markets performed well with the S&P strongly rising by double digit percentage points.So relative to the US market return last year frontier markets did not outperform by a huge margin.

The dividend yield on the MSCI Frontier Markets 100 Index which is tracked by the iShares MSCI Frontier 100 ETF (FM) was 3.62% at the end of last month. This is much higher than the S&P 500’s dividend yield of around 2.0%.

Frontier markets are not for the faint of heart. They are riskier than emerging markets. Generally frontier market stocks may not be suitable for most of the investors. However investors willing to take huge risks and diversify internationally can consider adding a very tiny part of their portfolio to these markets.Despite the huge gains in 2013 and the high dividend yield, the risks are far too high investing in places like Vietnam, Morocco, Nigeria, etc.

Disclosure: Long PBR

The Top 10 Global Paint Companies Based On Sales

The global paint industry is a multi-billion dollar industry. One cannot imagine a world without paints. They are an integral part of modern world. In fact, paints help us color our world. Paint companies produce a variety of products in addition to just paints. These products are used in many industries.For example, AkzoNobel, the world’s top paint maker operates its business units in the following categories:

  • Automotive and Aerospace Coatings
  • Industrial Coatings (e.g. coil, wood and packaging)
  • Marine and Protective Coatings
  • Powder Coatings

Its products can be found in many of the consumer goods as shown in the diagram below:

Click to enlarge

AkzoNobel Products Home

Source: AkzoNobel

From a long-term investment perspective, paint companies are attractive simply due to a fact that paints and related-products are used pretty much in most industries. A recovering housing market for instance benefits paint makers. Similarly the building of infrastructure in emerging markets in growing markets such as China helps them as well. A few years ago I made a decent profit when British paint company Imperial Chemical Industries (ICI) was acquired by AkzoNobel.

A ranking of the top manufacturers of paints, coatings, adhesives, and sealants based on annual sales in 2013 was published by Coatings World magazine in July. The ranking included both public and private firms.

The following are the top 10 companies from that list:

1. AkzoNobel (The Netherlands) $13.300 billion
2. PPG (USA) $12.78 billion
3. Henkel (Germany) $11.174 billion
4. Sherwin-Williams (USA) $9.340 billion•
5. Axalta (USA) $4.300 billion
6. RPM (USA) $4.100 billion
6. Valspar (USA) $4.100 billion
8. BASF (Germany) $3.95 billion
9. Kansai (Japan $3.126 billion
10. Sika (Switzerland) $$3.118 billion

Note: Sales figures noted are annual sales in US dollars.

Source: Top Companies Report 2014, Coatings World, July 14, 2014

The Netherlands-based AkzoNobel trades on the OTC market under the ticker AKZOY. Currently it has a market capitalization of about $15.0 billion. Pittsburg-based PPG Industries Inc (PPG), the second largest company has a market cap of over $24.0 billion followed by Germany’s Henkel (HENKY). Other companies from the above list that trade on the US markets are The Sherwin-Williams Company (SHW), The Valspar Corporation (VAL), RPM International Inc. (RPM) and BASF AG (BASFY).

Disclosure: Long AKZOY, HENKY

Comparing U.S. Oil Production To Select Countries

The production of Crude Oil in the U.S. continues to rise. The explosive growth in the exploration of oil by fracking and other factors have contributed to a resurgence of the country as a major oil producer.

U.S. crude oil production continuously rose from 1920 and reached its peak in 1970. After a stead decline from that time, production has regained momentum and has followed an upward trend since mid-2008 as shown in the chart below:

Click to enlarge

US Oil Production Chart

Source: U.S. Energy Information Administration

Note: The figures shown above are daily production figures.

In July of this year crude oil production totaled 8,537 Thousand Barrels per Day.

How does the US oil production compare to certain oil producing countries?

The map below shows the answer to the above question.

Click to enlarge

US Oil Map

Via Malaysia-Finance

It is interesting that Texas produces more oil than UAE.

Related ETN:

  • iPath S&P GSCI Crude Oil TR ETN (USO)

Disclosure: No Positions