Bonds are an important asset class to own in a diversified portfolio. Bonds offer many benefits such as providing a stable income, relatively better safety with high-quality bonds, preservation of capital, etc. Another important point to note about bonds is that they tend to cushion a portfolio during adverse equity markets. To put it in a different way, traditionally when stocks decline bonds tend to go up and vice versa. So depending on an investor’s long-term goals and risk tolerance, a small amount of bonds can be added to a portfolio consisting of various asset classes.
I came across an article in the journal last month that noted bonds also fell in 2022 when equities plunged. It was the first time this happened. From the piece:
Bonds helped offset some of the pain of the previous market crises, including the bursting of the dot-com bubble in 2000, the global financial crisis of 2008 and the short-lived market panic brought by the onset of the Covid-19 pandemic.
That didn’t happen in 2022. An index that largely holds Treasurys, highly rated corporate bonds and mortgage-backed securities fell 13%, posting its worst year on record, while the S&P 500 declined 18%.
Click to enlarge
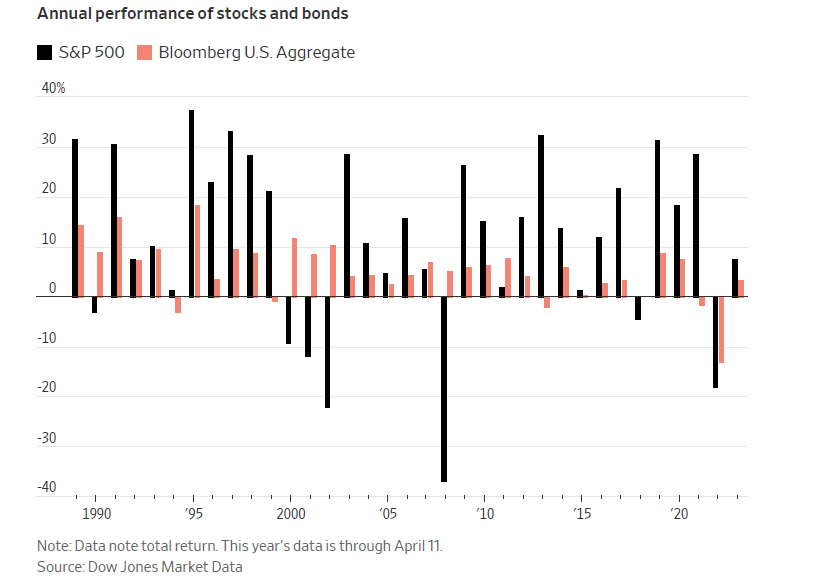
Source: The 60-40 Investment Strategy Is Back After Tanking Last Year, WSJ
Related ETFs:
- SPDR S&P 500 ETF (SPY)
- Vanguard Total Bond Market ETF (BND)
- iShares iBoxx $ Investment Grade Corporate Bond ETF (LQD)
Disclosure: No positions