Australian Household Debt Remains High

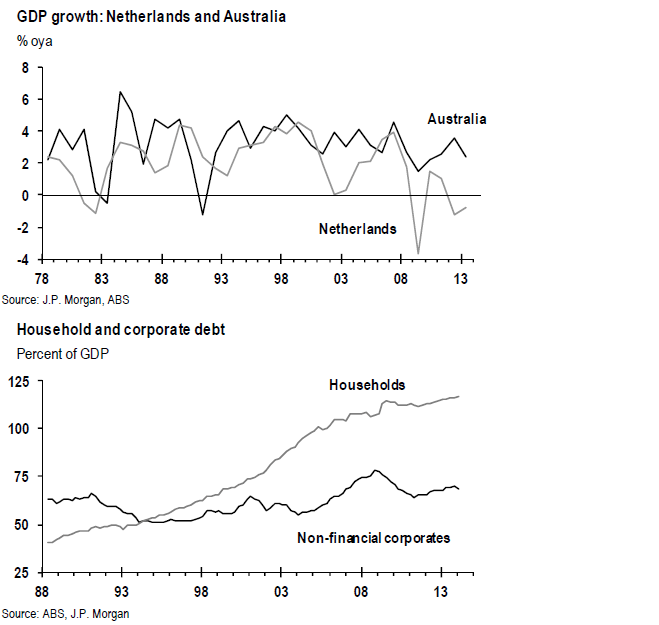
The Australian economy has performed relatively well among the developed economies. In fact, Australia escaped largely unscathed during the global financial crisis of 2008-09 when Europe and the U.S. economies went into a  tailspin. According to  a report by J.P.Morgan Australia has avoided recession for 23 years even beating the performance of The Netherlands.

Australia’s economy has had positive growth for the past 23 years. The Dutch economy had 27 years of growth until the global  financial crisis broke the record run when the GDP growth fell by 4.2%.

The JP Morgan report does not forecast a recession for the Australian economy. However it does point out certain negative factors that could cause a recession. One of the negative factor that investors need to be worried about is that the household debt remains excessive compared to corporate debt (measured relative to  GDP) as shown in the chart below:

Click to enlarge

BEST-Australia Corporate vs Household Debt

Source:  JPM Global Data Watch, J.P. Morgan

Australian companies have reduced their debt from 78% of GDP in 2008 to 69% now. But households have continued to accumulate debt at a steady pace over the years.Currently the debt to income ratio stands at 1.5 times and is among the world’s highest.

With global demand for natural resources continuing to decline the unemployment rate could spike from current low levels leading to problems in the housing market. Hence investors in Australian equity markets have to be cautious and hedge their bets accordingly.

Related ETFs:

  • iShares MSCI Netherlands (EWN)
  • iShares MSCI Australia Index (EWA)

Disclosure: Long EWN

Why Investing in U.S. Multinationals is Not the Same as Investing in Foreign Companies

One way to invest in foreign markets is by simply buying stocks of U.S. multinationals. With these firms investors need not worry too much about lack  of transparency, governance, accounting issues, etc. as they follow U.S. laws and adhere to the standards common to businesses operating in the U.S. Hence by investing in these multinationals investors get the best of worlds as they profit from the economic growth overseas from which the multinationals prosper and at the same time benefit from owing an American corporation. However there is one flaw with this argument.

Trying to gain exposure to foreign countries by owning stocks of U.S. multinationals is not the same as owing equity in the domestic companies of those countries. If all one needs to do in order to diversify globally is just invest in American multinationals then there won’t be any need for investing in any of the hundreds of foreign stocks trading in the U.S. or any of the other tools such as foreign-focused ETFs, CEFs, mutual funds etc. The benefits of investing directly in foreign domestic companies via ADRs or ordinary shares in the local market cannot be underestimated.

Michelle Gibley of Charles Schwab discussed the reasons for investing in foreign firms instead of U.S. multinationals in an article back in May. From the article titled “4 Mistakes to Avoid in International Investing“:

  • “The stocks of U.S. multinational companies tend to move in tandem with other U.S. stocks, and U.S. multinationals typically still derive a large percentage of their profits from the United States. But this misses the point of investing internationally—to diversify into areas that aren’t so highly correlated with the U.S. market.
  • Similarly, multinationals have a greater tendency to hedge currency exposure—and one reason to invest internationally is to increase your currency diversification, not reduce it.
  • U.S. multinationals may not do as well as local competitors in their target foreign markets due to cultural and local differences. After all, not everyone prefers U.S. brands, and some U.S. companies have difficulty customizing products for foreign markets.
  • The U.S. share of the global stock market is declining, so investing in U.S. multinationals means missing out on different opportunities elsewhere. When you look at global GDP, non-U.S. countries dominate, indicating the market share of these countries has room to grow.
  • Owning large multinational companies means excluding small cap companies that are more closely tied to the economic conditions in their local markets. International small cap stocks have even lower correlations to U.S stocks than large cap international stocks.”

Source: 4 Mistakes to Avoid in International Investing, Charles Schwab

Ten foreign multinationals from the developed world are listed below for consideration:

1.Company: AstraZeneca PLC (AZN)
Current Dividend Yield: 3.98%
Sector: Pharmaceuticals
Country: UK

2.Company: Vodafone Group PLC (VOD)
Current Dividend Yield: 7.02%
Sector: Wireless Telecom
Country: UK

3.Company: British American Tobacco PLC (BTI)
Current Dividend Yield: 4.13%
Sector:Tobacco
Country: UK

4.Company: Total SA (TOT)
Current Dividend Yield: 5.06%
Sector:Oil, Gas & Consumable Fuels
Country: France

5.Company: Sanofi (SNY)
Current Dividend Yield: 3.57%
Sector: Pharmaceuticals
Country: France

6.Company: BASF SE (BASFY)
Current Dividend Yield: 3.67%
Sector:Chemicals
Country: Germany

7.Company: Siemens AG (SIEGY)
Current Dividend Yield: 3.32%
Sector:Industrial Conglomerates
Country: Germany

8.Company: Diageo PLC (DEO)
Current Dividend Yield: 2.91%
Sector: Beverages
Country: UK

9.Company: Novo Nordisk A/S (NVO)
Current Dividend Yield: 1.84%
Sector: Pharmaceuticals
Country: Denmark

10.Company:Telenor ASA (TELNY)
Current Dividend Yield:
Sector: Telecom
Country: Norway

Note: Dividend yields noted are as of Aug 19, 2014. Data is known to be accurate from sources used.Please use your own due diligence before making any investment decisions.

Disclosure: No Positions

Some Observations on The Periodic Table of Emerging Markets 2004-2013

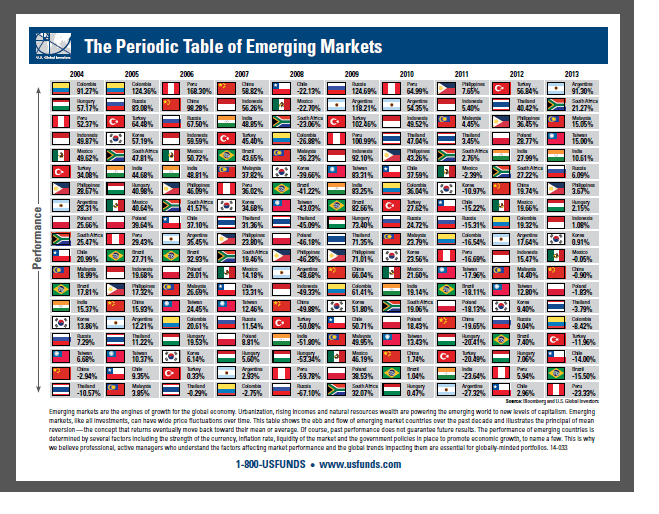
The Callan Periodic Table of Investment Returns shows the annual returns for 20 years for many categories.It is a valuable tool to show the importance of diversification among asset classes. Similar to the Callan Table the following periodic table shows the annual returns for many single country emerging markets from 2004 thru 2013:

Click to enlarge

Best Periodic Table of Emerging Markets

Source: US Funds

Some observations from the above table:

  • Last year some of the traditional favorite emerging markets such as Brazil and Chile were the worst performers while Argentina was the top performer followed by South Africa. Note: The returns noted are the benchmark returns for the country. Brazil’s Bovespa was down 15.5% in 2013.
  • After peaking in 2009, Brazil has disappointed investors every year since with poor to average returns.
  • Mexican stocks has generally yielded good returns in each of the years shown.Even during the depth of the global financial crisis in 2008. Mexico was down only over 22% compared to worse returns for other emerging markets.
  • The performance Russian equity market is closely tied to the price of crude oil. As oil prices soared in 2009, Russian stocks generated a 125% return. However in 2013 as oil prices stabilized Russia yielded an average return of over 6%.
  • Other than Colombia and Peru, no country has been the best performer two years in a row for the period shown. This is why diversification between countries is important. In the past five years the best performing country was different each year.
  • The worst performing country in one year can become the best performing country the next year. In 2008, Russian stock collapsed with a loss of over 67%. But the following year they soared by around 125%. Hence this shows the extreme volatility of emerging markets and the need for diversification among countries.
  • Emerging markets can go from global investors’ top destination to just another emerging market quickly. For example, Chinese stocks ranked the best among emerging markets in 2007 but fell hard the following year in line with other BRIC countries like India and Russia. While in 2007 Chinese equities returned 66% since then their annual performance has been poor.The main reason for this dismal performance is that the Chinese economic growth slowed and investors’ appetite for Chinese stocks has decreased gradually over the years.

 Related ETFs:

  • iShares MSCI Emerging Markets Index Fund (EEM)
  • Vanguard Emerging Markets ETF (VWO)
  • iShares MSCI Brazil Index Fund (EWZ)
  • Market Vectors Russia ETF (RSX)
  • iShares FTSE/Xinhua China 25 Index Fund (FXI)
  • iShares S&P India Nifty 50 ETF (INDY)

For a better quality image you can download the pdf version of the above chart at the US Funds site.

Disclosure: No Positions

A Brief Review of Trade Between US and Russia

usa russia flagThe U.S.and other Western countries have imposed a wave of trade sanctions against Russia in the past few months. The goal of these sanctions is to weaken the Russian economy.However since Russia is very rich in all types of natural resources it remains to be seen if these sanctions have any impact in the coming months and years. The effect of these sanctions may be insignificant particularly for the U.S. and Russia since the trade between the countries is low by global standards.

In 2013, the top five US trade partners were Canada, China, Mexico, Japan and Germany in that order. U.S. exports to Canada amounted to over $300.o billion in goods alone while imports from Canada totaled over $330.o billion. The U.S. imported over $440.0 B in goods from China last year. China imported about $122.0 B worth of goods from the U.S.

In comparison, Russia’s trade with the U.S. and vice versa was small. Russia ranked as the 23rd largest trade partner with the U.S. with total trade of just over $38.0 billion.

Here are a few other interesting facts on US-Russia trade:

  • U.S. goods exports to Russia totaled just over $11.0 billion in 2013.
  • U.S. imported goods totaling $27.0 billion.
  • Russia was the 28th largest export market for the U.S.
  • The top export categories were: Machinery, Vehicles, Aircraft , Electrical Machinery , and Optic and Medical Instruments.
  • U.S. exported agricultural products worth $1.2 billion. Some of the top categories were: poultry meat , tree nuts, soybeans, and live animals.
  • The five largest import categories were: Mineral Fuel (oil) , Iron and Steel, Inorganic Chemical (enriched uranium) , Fertilizers, and Precious Stones (platinum).

Sources: U.S. Census Bureau, Office of the United States Trade Representative

A Review of the Top Global Auto-Parts Makers

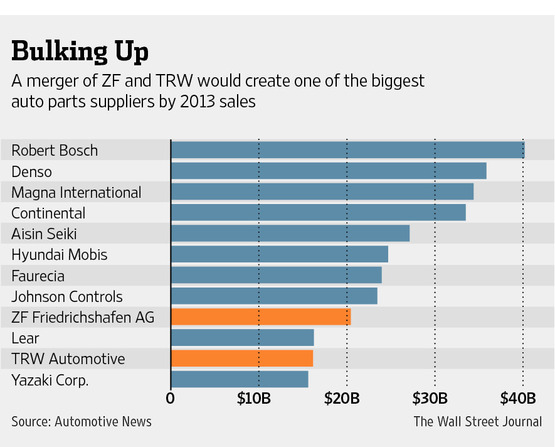
German auto-parts maker ZF Friedrichshafen AG announced a bid to acquire US-based TRW Automotive Holdings Corp. (TRW) in a deal worth $12.0 billion last month. However the deal is being held due to the German firm’s negotiations with Robert Bosch GmbH, Germany’s largest auto-parts manufacturer, to exit a joint venture according to a recent report by Bloomberg. The merger of ZF and TRW would create the world’s second largest auto-parts company by sales just behind Stuttgart-based Bosch.

TRW is a major leader in car-safety technology while ZF is a top maker of transmissions, steering systems, clutches and axles.

In an article this week The Wall Street Journal reported that M&A deals in this sector could increase as other companies look for deals. From the article:

In a study to be published later this month, PricewaterhouseCoopers LLP will report that while deal sizes are shrinking slightly, far more transactions are getting done and that trend is expected to accelerate in 2014. European suppliers, are showing renewed vigor amid rising sales in their core markets, and Chinese suppliers—spending the most on R&D and growing fastest—are consistent drivers of deal activity.

Private-equity firms, meanwhile, remain active suitors (the biggest in 2014 was the purchase of Gates Corp. by Blackstone Group for $5.4 billion).

ZF’s deal is expected to further boost the appetite for strategic deals. In a note to investors, Morgan Stanley auto analyst Adam Jonas said certain suppliers “should prioritize and aggressively pursue acquisitions, especially in light of a potential TRW+ZF combination.”

Top Global Auto Parts Makers

Source: Auto-Parts Giants Hunt for Mergers, The Wall Street Journal, Aug 13, 2014

The top twelve global auto-parts makers by sales shown in the above chart are listed below with their ADR ticker, if available and current dividend yield:

1. Robert Bosch
Country: Germany

2. Company: Denso (DNZOY)
Current Dividend Yield:  1.30%
Country: Japan

3.Company: Magna International Inc (MGA)
Current Dividend Yield: 1.36%
Country: Canada

4.Company: Continental AG (CTTAY)
Current Dividend Yield: 1.68%
Country: Germany

5.Company: Aisin Seiki (ASEKY)
Current Dividend Yield: N/A
Country: Japan

6.Company: Hyundai Mobis 
Country: South Korea

7.Company: Faurecia (FURCY)
Current Dividend Yield: N/A
Country: France

8.Company: Johnson Controls, Inc.(JCI)
Current Dividend Yield: 1.86%
Country: USA

9.Company: ZF Friedrichshafen AG
Country: Germany

10.Company: Lear (LEA)
Current Dividend Yield: 0.82%
Country: USA

11. Company: TRW Automotive Holdings Corp. (TRW)
Current Dividend Yield: No Regular Dividends paid
Country: USA

12. Company: Yazaki Corp
Country: Japan

Some of the other US-based auto-parts suppliers are Johnson Controls, Inc.(JCI), O’Reilly Automotive Inc (ORLY) and Genuine Parts Company (GPC).

Note: Dividend yields noted above are as of Aug 15, 2014. Data is known to be accurate from sources used.Please use your own due diligence before making any investment decisions.

Disclosure: DNZOY, CTTAY