Robots are increasingly deployed in industrial settings as the cost has fallen by 50% over the past 30 years according to an article at Blackrock’s iShares. In some countries rising aging population leads to labor shortages. The usage of automation via robots increases in these countries to alleviate the effects of declining labor. For example, South Korea and Japan are big users of robots due to declining population.
The following chart shows Robot Density in the Manufacturing Industry as of 2021:
Click to enlarge
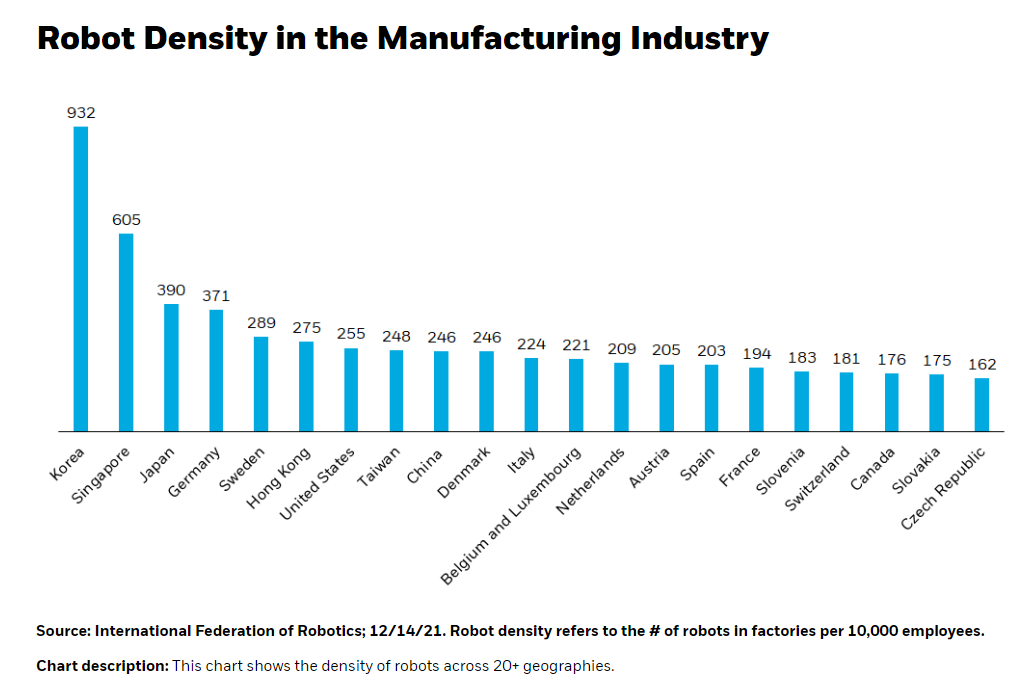
Source: Investing in robotics: why now could be the right time, iShares
The full article is worth a read.
Earlier:
Related: