Crude oil (Brent) closed at $48.23 a barrel yesterday on the NYMEX for March delivery. The fall in oil prices in recent months is benefiting some industries and hurting others. For example, convention wisdom says big consumers of oil such as chemical companies, transportation firms, etc. are bound to benefit while oil producers, oil distributors and other related-companies in the industry can be expected to suffer.
I wrote an article recently on how to profit from lower oil prices. I specifically noted that the consumer staples sector will benefit and mentioned a few firms like Kellogg(K), Kraft Foods Group(KFT), etc. as potential investment opportunities. In another post I discussed how lower prices is not a big boon to all chemical firms. A recent post on FT’s beyondbrics blog, discussed about the winners and losers of lower oil prices in Emerging Markets. From that post:
Click to enlarge
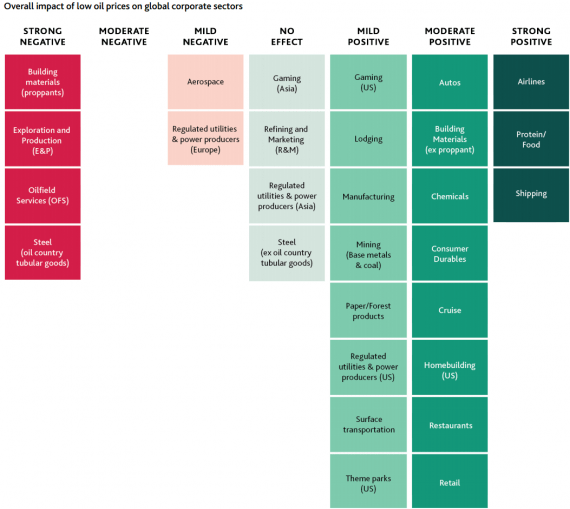
Industry winners and losers
Moody’s, the rating agency, identifies airlines, food and shipping industries as the outright winners from lower oil prices (see chart). With fuel representing between about 30 per cent and 50 per cent of an airline’s operating expenses, the airlines that are set to benefit most are low-cost carriers which have pared back non-fuel costs. Airlines in the US, in particular American Airlines, Delta and United, are also particular beneficiaries because they have relatively low exposure to the strong US dollar, Moody’s said in a report.In terms of food, a sustained period of low oil prices would boost household discretionary incomes – thus driving consumer spending. Thus Nestlé, Mondelez, International, Kellogg and Kraft Foods Group – among others – should benefit.
Global shipping companies, particularly container shipping companies, would benefit because fuel accounts for 20 per cent to 25 per cent of costs for container shipping companies, Moody’s said.
Source: Oil price slump cleaves divisions between EM winners and losers, Jan 15, 2015, FT beyondbrics blog
Investors looking to diversify their portfolio can consider adding some of the following ten foreign food and airline stocks:
1.Company: Copa Holdings SA (CPA)
Current Dividend Yield: 3.69%
Sector: Airlines
Country: Panama
2.Company: Avianca Holdings S.A. (AVH)
Current Dividend Yield: 2.61%
Sector: Airlines
Country: Colombia
3.Company: Singapore Airlines Limited (SINGY)
Current Dividend Yield: 3.58%
Sector: Airlines
Country: Singapore
4.Company: easyJet plc (ESYJY)
Current Dividend Yield: 4.97%
Sector: Airlines
Country: UK
5.Company: LATAM Airlines Group S.A. (LFL)
Current Dividend Yield: Not paid
Sector: Airlines
Country: Chile
6.Company: Unilever NV (UN)
Current Dividend Yield: 3.71%
Sector: Food Products
Country: The Netherlands
7.Company: Nestle SA (NSRGY)
Current Dividend Yield: 3.19%
Sector: Food Products
Country: Switzerland
8.Company: Danone SA (DANOY)
Current Dividend Yield: 3.03%
Sector:Food Products
Country: France
9.Company: Unilever PLC (UL)
Current Dividend Yield: 3.61%
Sector: Food Products
Country: UK
10.Company: Cathay Pacific Airways Limited (CPCAY)
Current Dividend Yield: 1.51%
Sector: Airlines
Country: Hong Kong
Note: Dividend yields noted above are as of Jan 20, 2015. Data is known to be accurate from sources used.Please use your own due diligence before making any investment decisions.
Disclosure: No Positions