S&P 500 P/E Ratios by Sector: Chart

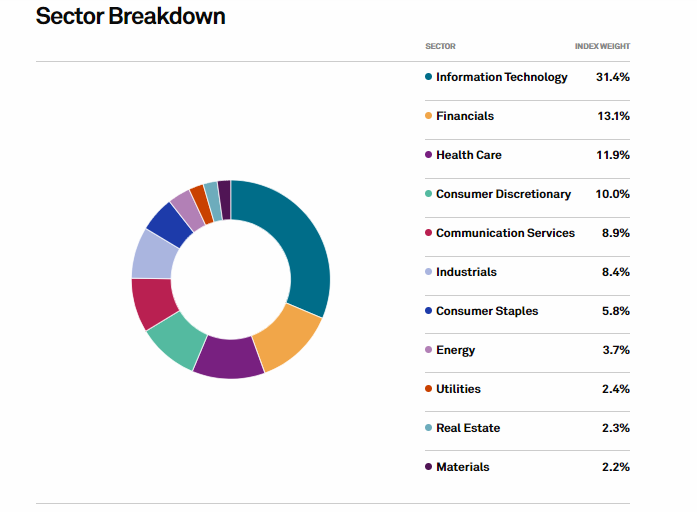
The S&P 500 is up a decent 11.52% on price-return basis as of yesterday August 8, 2024 despite the sell-off in the markets last week. The annualized return over the past 5 years is 12.61%. The tech sector as represented by Information Technology and Communication Services accounts for just over 40% of the index as shown in the chart below. Hence in some ways the direction of the index is heavily influenced by tech stocks.

S&P 500 Sectors by Weight:

Click to enlarge
Source: S&P 500

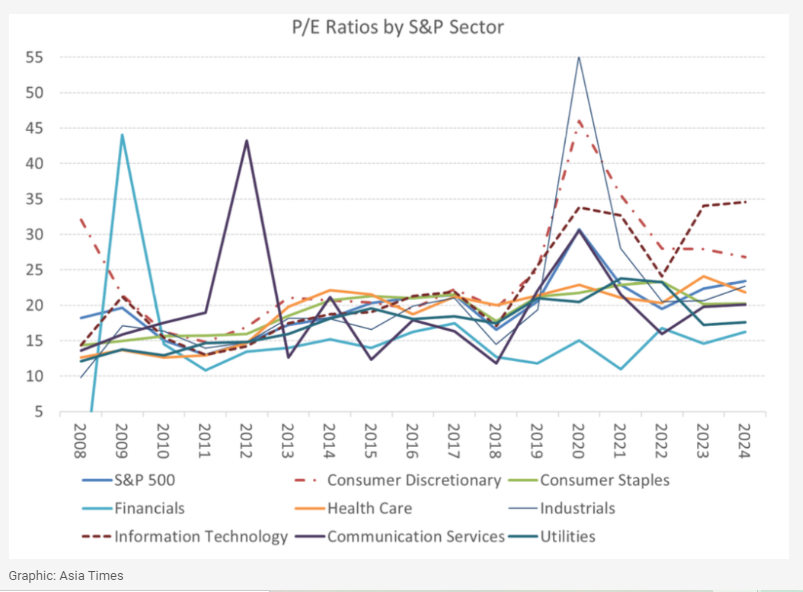
With that said the P/E ratio of the Information Technology sector remains elevated and is the highest of all the sectors in the index according to a recent article in Asia Times.

Click to enlarge
Source: A tale of two bubbles, Asia Times

As the US economic data continues to give mixed signals and the Fed is ready to reduce the interest rates soon, further volatility in equity markets can be expected. Investors need to be aware of this and act accordingly.

Related ETFs:

  1. SPDR S&P 500 ETF (SPY)
  2. iShares Core S&P 500 ETF (IVV)
  3. Vanguard S&P 500 ETF(VOO)
  4. SPDR Portfolio S&P 500 ETF  (SPLG)

Disclosure: No positions
U.S. Lags in Dividend Yield Relative to Other Regions

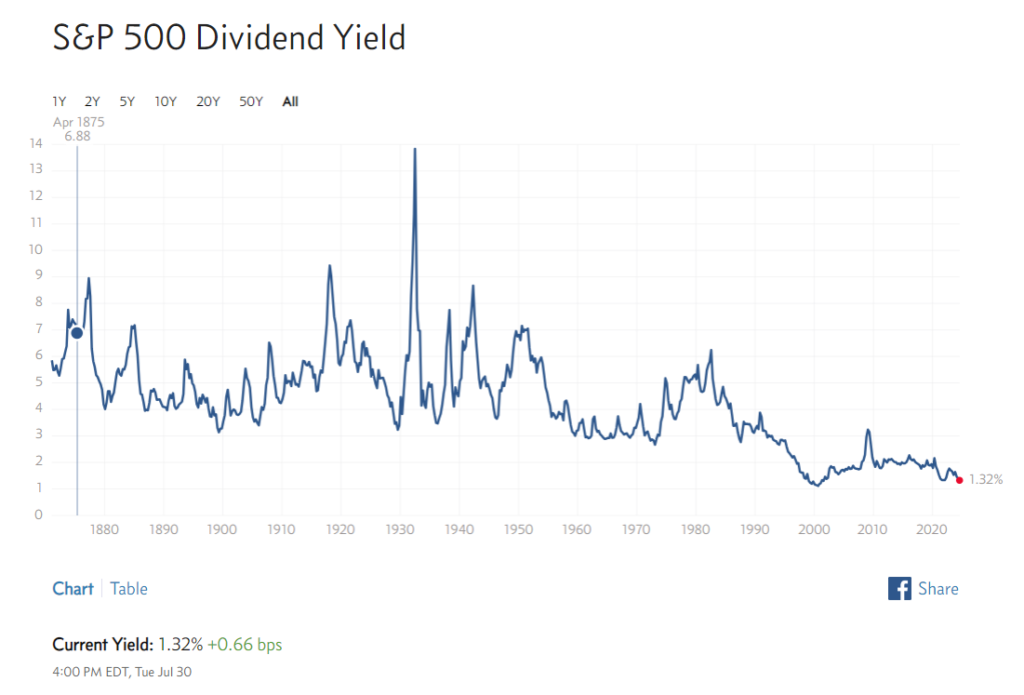
The U.S. lags many regions of the world in terms of dividend yields. Hence investors looking for income can find better opportunities outside of the country. The dividend yields on US stocks have been on the decline for many years now due to tax policy and other factors. Currently the yield on the S&P 500 is just 1.32% as shown in the chart below:

Click to enlarge

Source: multpl.com

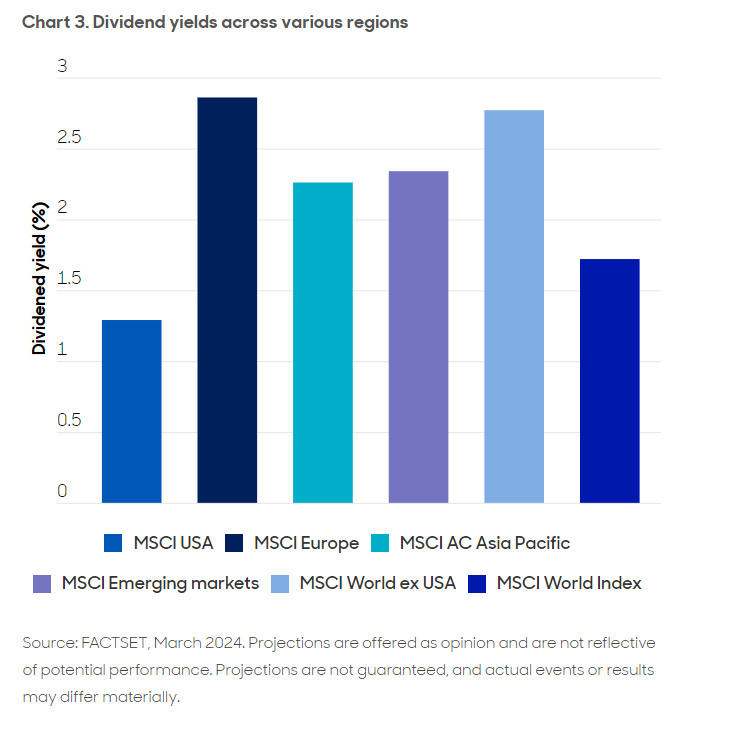
The following chart shows the dividend of various regions using the MSCI index. It shows European companies pay more than double the dividend yield of their U.S. peers. Even Emerging Markets have higher dividend yields than the U.S. The dividend culture in the US has eroded in the past few decades as the market has gravitated towards growth than income.

Click to enlarge

Source: Home bias blues? The case for international diversification, abrdn Investments

Related ETFs:

  • SPDR S&P 500 ETF (SPY)
  • iShares MSCI Emerging Markets ETF (EEM)
  • Vanguard MSCI Emerging Markets ETF (VWO)

Disclosure: No positions

A Quick Note on Ecopetrol’s Upcoming Dividend

Colombian oil major Ecopetrol(EC) will pay its 2nd dividend payment for the year later this month. The Ex-Dividend Date for the ADR is June 24th and the dividend will be paid on July 3rd. The Dividend amount is 3,120 Colombian pesos per DR. So at today’s exchange rate this would amount to $0.805 per DR. Of course, the actual amount paid will vary based on the exchange rate on July 3rd.

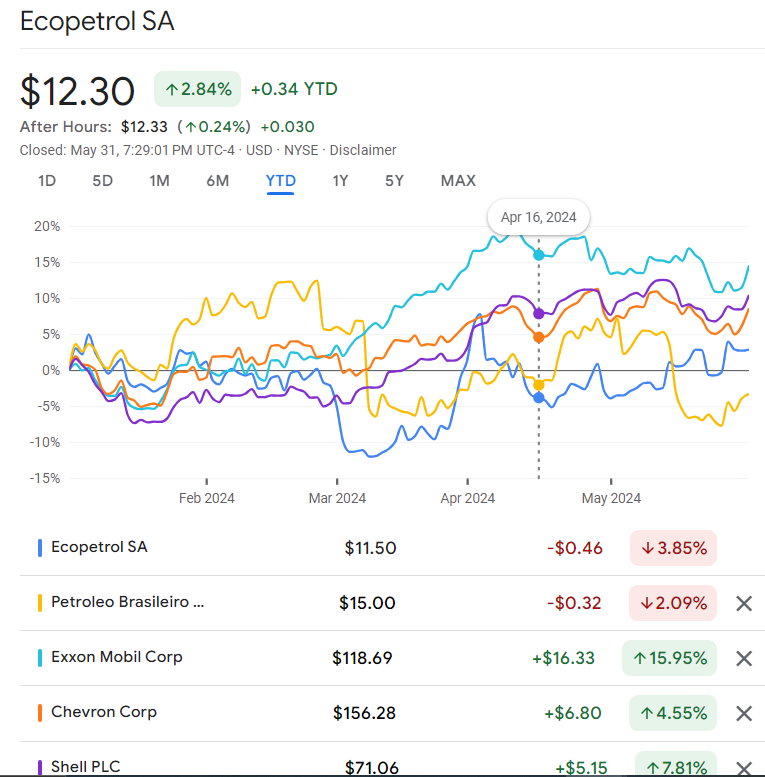
Currently there is no dividend withholding taxes charged by Colombia. So the dividend received will be the full amount for US investors. Ecopetrol closed at $12.30 on Friday and is mostly flat for the year. At the current share price the dividend yield is over 13% for 2024. This included the 1st payment of the same amount paid in April this year.

The following chart shows the YTD price returns of Ecopetrol vs. a few other oil majors:

Click to enlarge

Source: Google Finance

Earlier:

Disclosure: Long EC

The Periodic Table of Commodities Returns 2023: Chart

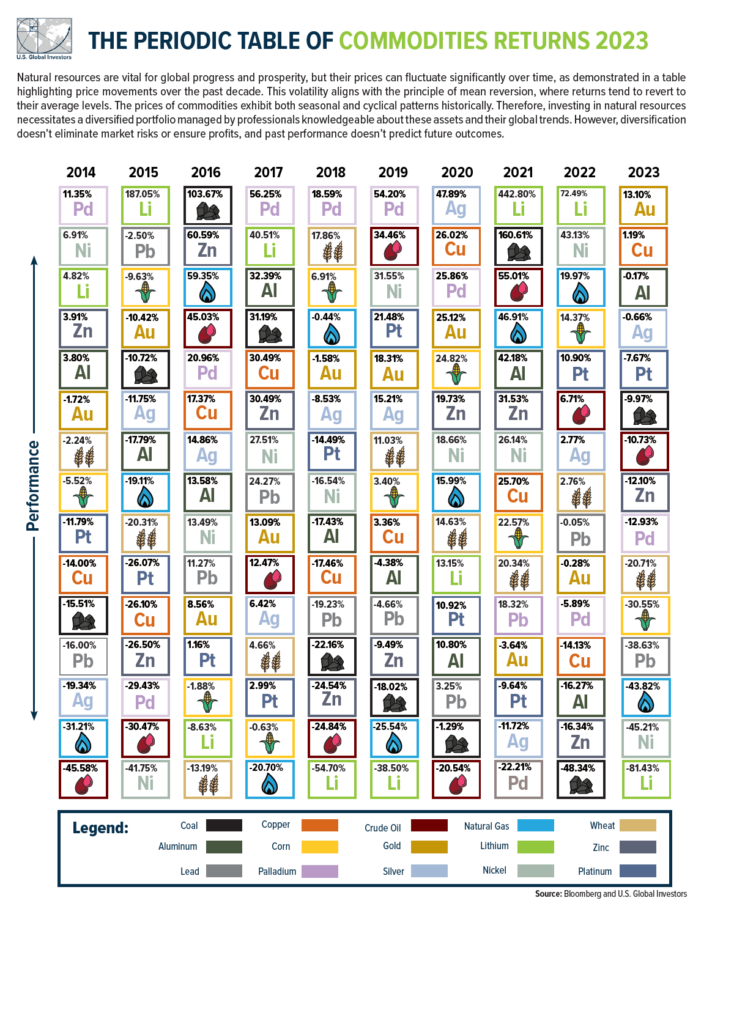
U.S. Global Investors published updated version of The Periodic Table of Commodities Returns chart with 2023 data earlier this year. Gold was the top performer last year with a return of over 13%. The worst performer was Lithium with a loss of about 82% as the craze for EV demand cooled last year.

Copper prices are soaring so far this year. The metal is up by about 25% YTD. It remains to be seen if Copper would end up as the best performing metal this year. Last year it had the second best return as shown in the chart below:

Click to enlarge

Source: U.S. Global Investors

For an interactive version of the above chart go here.

elated ETFs and companies:

  • Barclays Bank iPath Pure Beta Crude Oil ETN Exp 18 Apr 2041 (OIL)
  • Albemarle Corporation (ALB)
  • Sociedad Quimica y Minera de Chile (SQM)
  • SPDR Gold Trust (GLD)

Disclosure: No positions

Government Debt-to-GDP vs. Interest Payments to Govt. Revenues for Select Countries: Chart

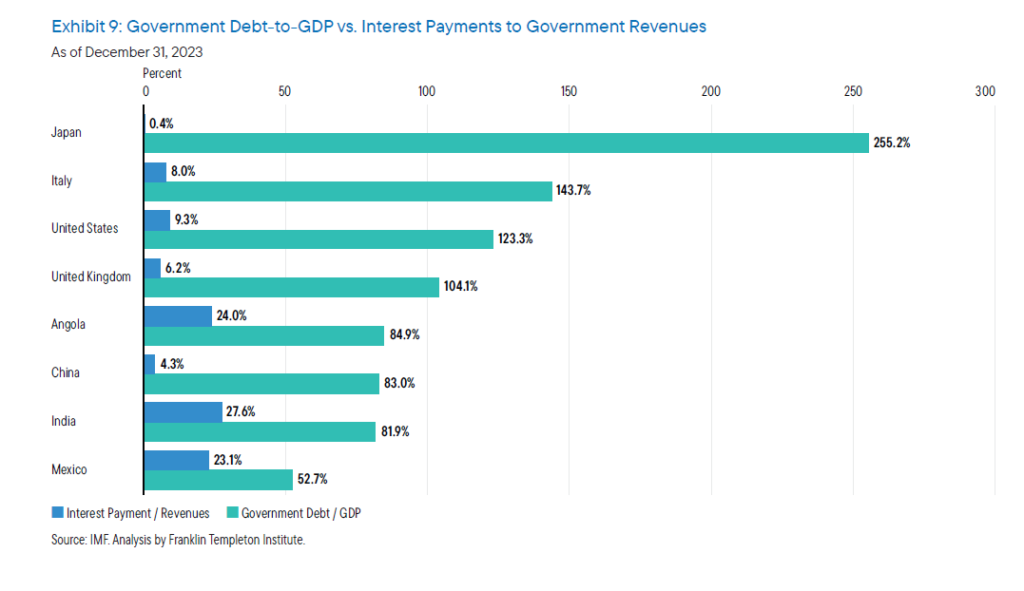
Many investors worry about the debt-to-GDP ratio when evaluating a country’s economy. For example, the US national debt is over $34.5 Trillion according to the US Treasury. The debt-to-GDP ratio stood at 124.7 % of the nominal GDP in March 2024. The record low was at 31.8%. The cost service the debt amounted to 2.4% of the GDP in 2023. In terms of dollars, total net interest payments was $658 billion in 2023. This figure is indeed small when compared to other countries. The key point is ability to service the debt and not the total debt outstanding. I came across the below chart that compared the debt-to-GDP ratio against the interest payments to government revenues for select countries in 2023:

Click to enlarge

Source: The demographic wave: The tide is going out, Franklin Templeton Institute

For many developing and frontier countries, the debt-to-GDP is not only high but the servicing cost of the debt is also high. For instance, Angola spent 24% of its revenue to service its 85% debt-to-GDP ratio. Or to put it another way, nearly one-fourth of its revenue went to interest payments. For Italy on the other hand, debt servicing cost was just 8%. So this gives the country the ability to access further credit unlike Angola. For India and Mexico, servicing cost was over 27% and 23% respectively in 2023.