Markets go thru many phases of bull and bear markets over decades. Though bear markets are difficult to handle, bull markets tend to be longer. For example, from 1980 to 2024 global stocks as represented by the MSCI World Index had bull markets whose duration were four times that of bear markets. In addition, the average total return was much higher during bull markets than the losses during bear markets.
Click to enlarge
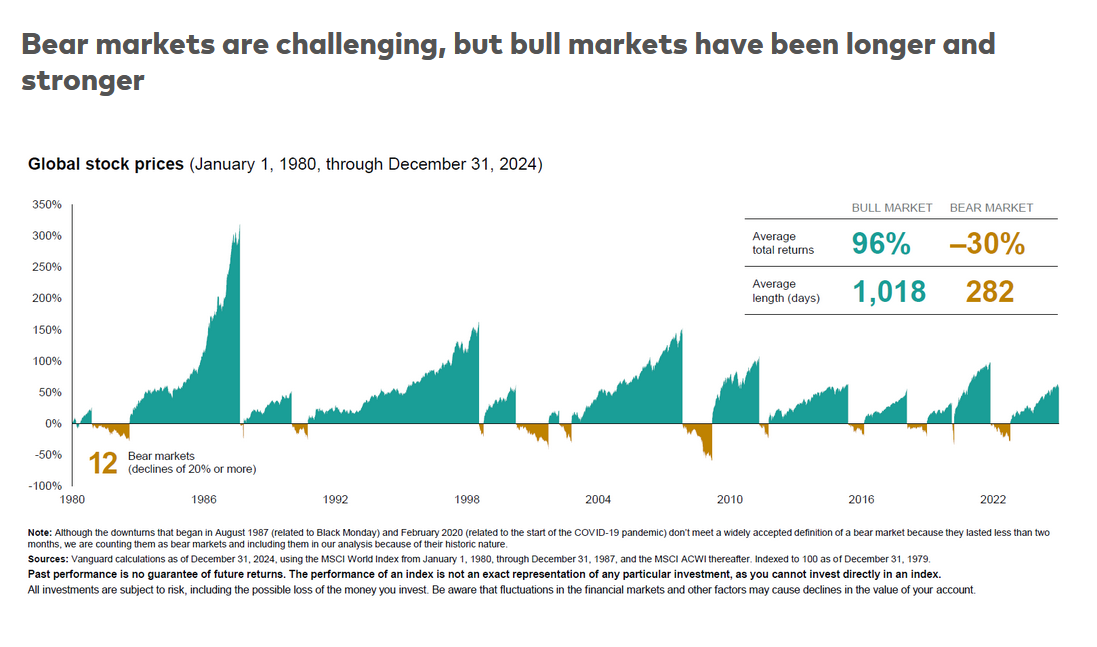
Source: When markets are volatile, it pays to stay invested, Vanguard Australia