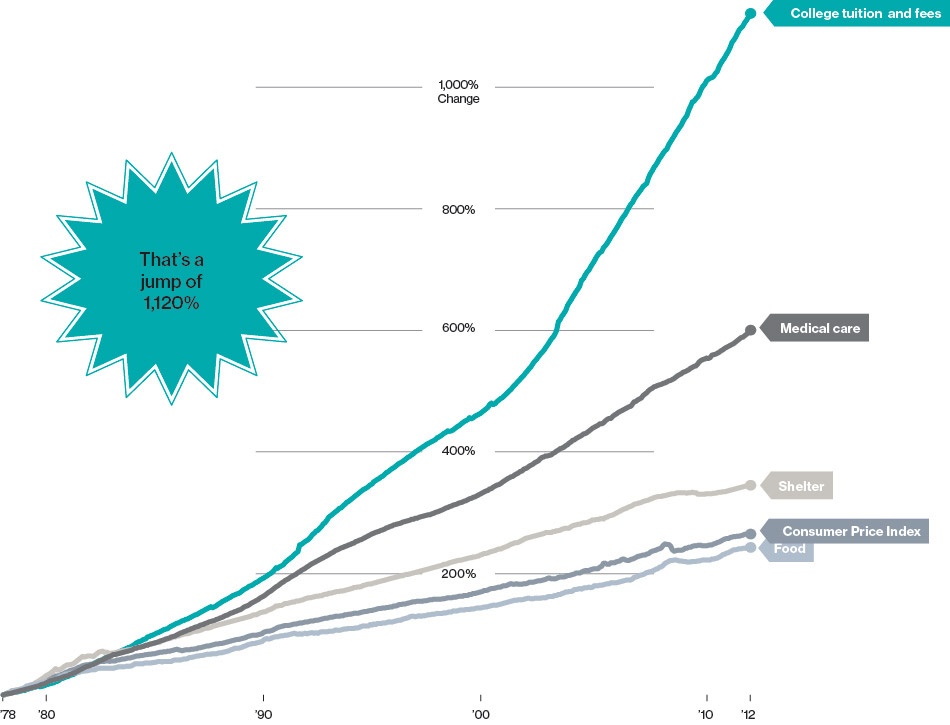
The unemployment rate remains high especially in select European markets. For example, Germany has the lowest rate and the rates continues to decline. While the unemployment rate in Germany and Spain are declining, France and Italy it remains stubbornly high and is not declining. According to a report by Natixis, a jobless recovery is currently occurring in France. The following charts show the contrast in unemployment rates in the four largest Eurozone economies:
Click to enlarge
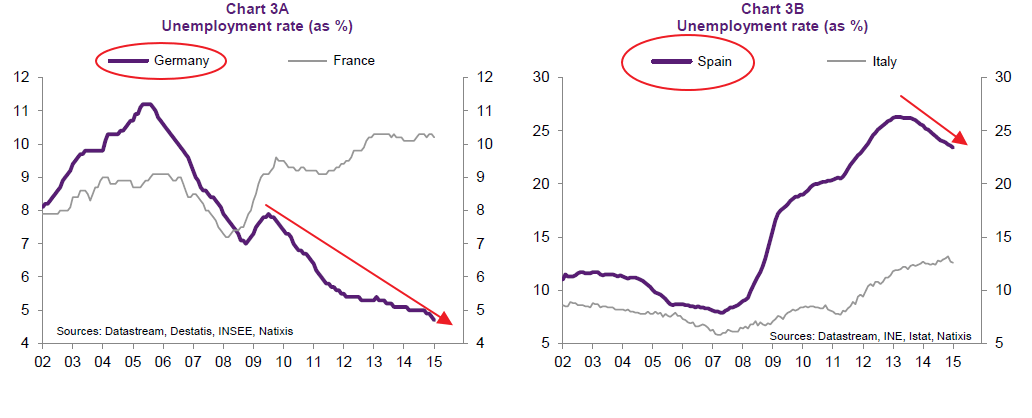
Source: Jobless recovery? by Patrick Artus, Natixis
The chart below shows the latest unemployment rates in the EU:
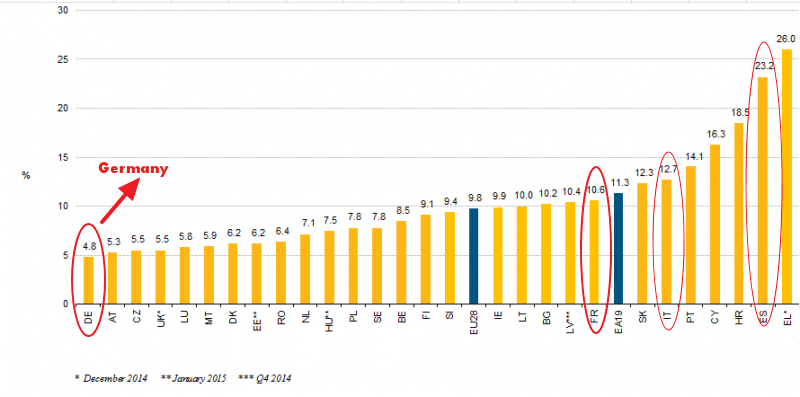
Source: Eurostat
The unemployment rate was just 4.8% in Germany in February. The highest rates were in Greece and Spain respectively at 26% (in December, 2014) and 23.2% respectively.
The following chart shows the comparison of unemployment rates in the US, Japan and Europe over the years:
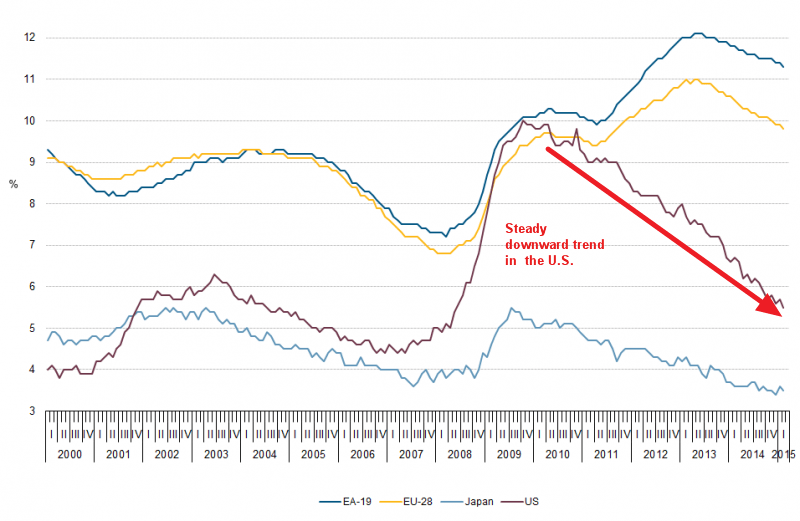
The Germany unemployment rate is closer to the U.S. rate. The US rate in February was 5.5%.