The Global Finance magazine published their annual list of the world’s safest banks for 2022 in November last year. With the banking sector under stress and many uncertainties facing investors, the list can be a good starting point for further research. Despite the dramatic decline in equity markets and economic volatility in 2022, the top 10 banks remained stable showing resilience. In fact, they remain unchanged from the previous year.
The world’s safest bank was Germany’s Kfw. This bank took the top spot for an astonishing 14th year in a row. Canada’s Royal Bank of Canada (RY) jumped from 20th rank a year ago to 11th this year.
Below is the methodology used by Global Finance to shortlist the winners:
Our rankings apply to the world’s largest 500 banks by asset size and are calculated based on long-term foreign currency ratings issued by Fitch Ratings, Standard & Poor’s and Moody’s Investors Service. Where possible, ratings on holding companies rather than operating companies were used; and banks that are wholly owned by other banks were omitted. Within each rank set, banks are organized according to asset size based on data for the most recent annual reporting period provided by Fitch Solutions and Moody’s. Ratings are reproduced with permission from the three rating agencies, with all rights reserved. A ranking is not a recommendation to purchase, sell or hold a security; and it does not comment on market price or suitability for a particular investor. All ratings in the tables were valid as of August 31, 2022.
The World’s Top 50 Safest Banks 2022:
Click to enlarge
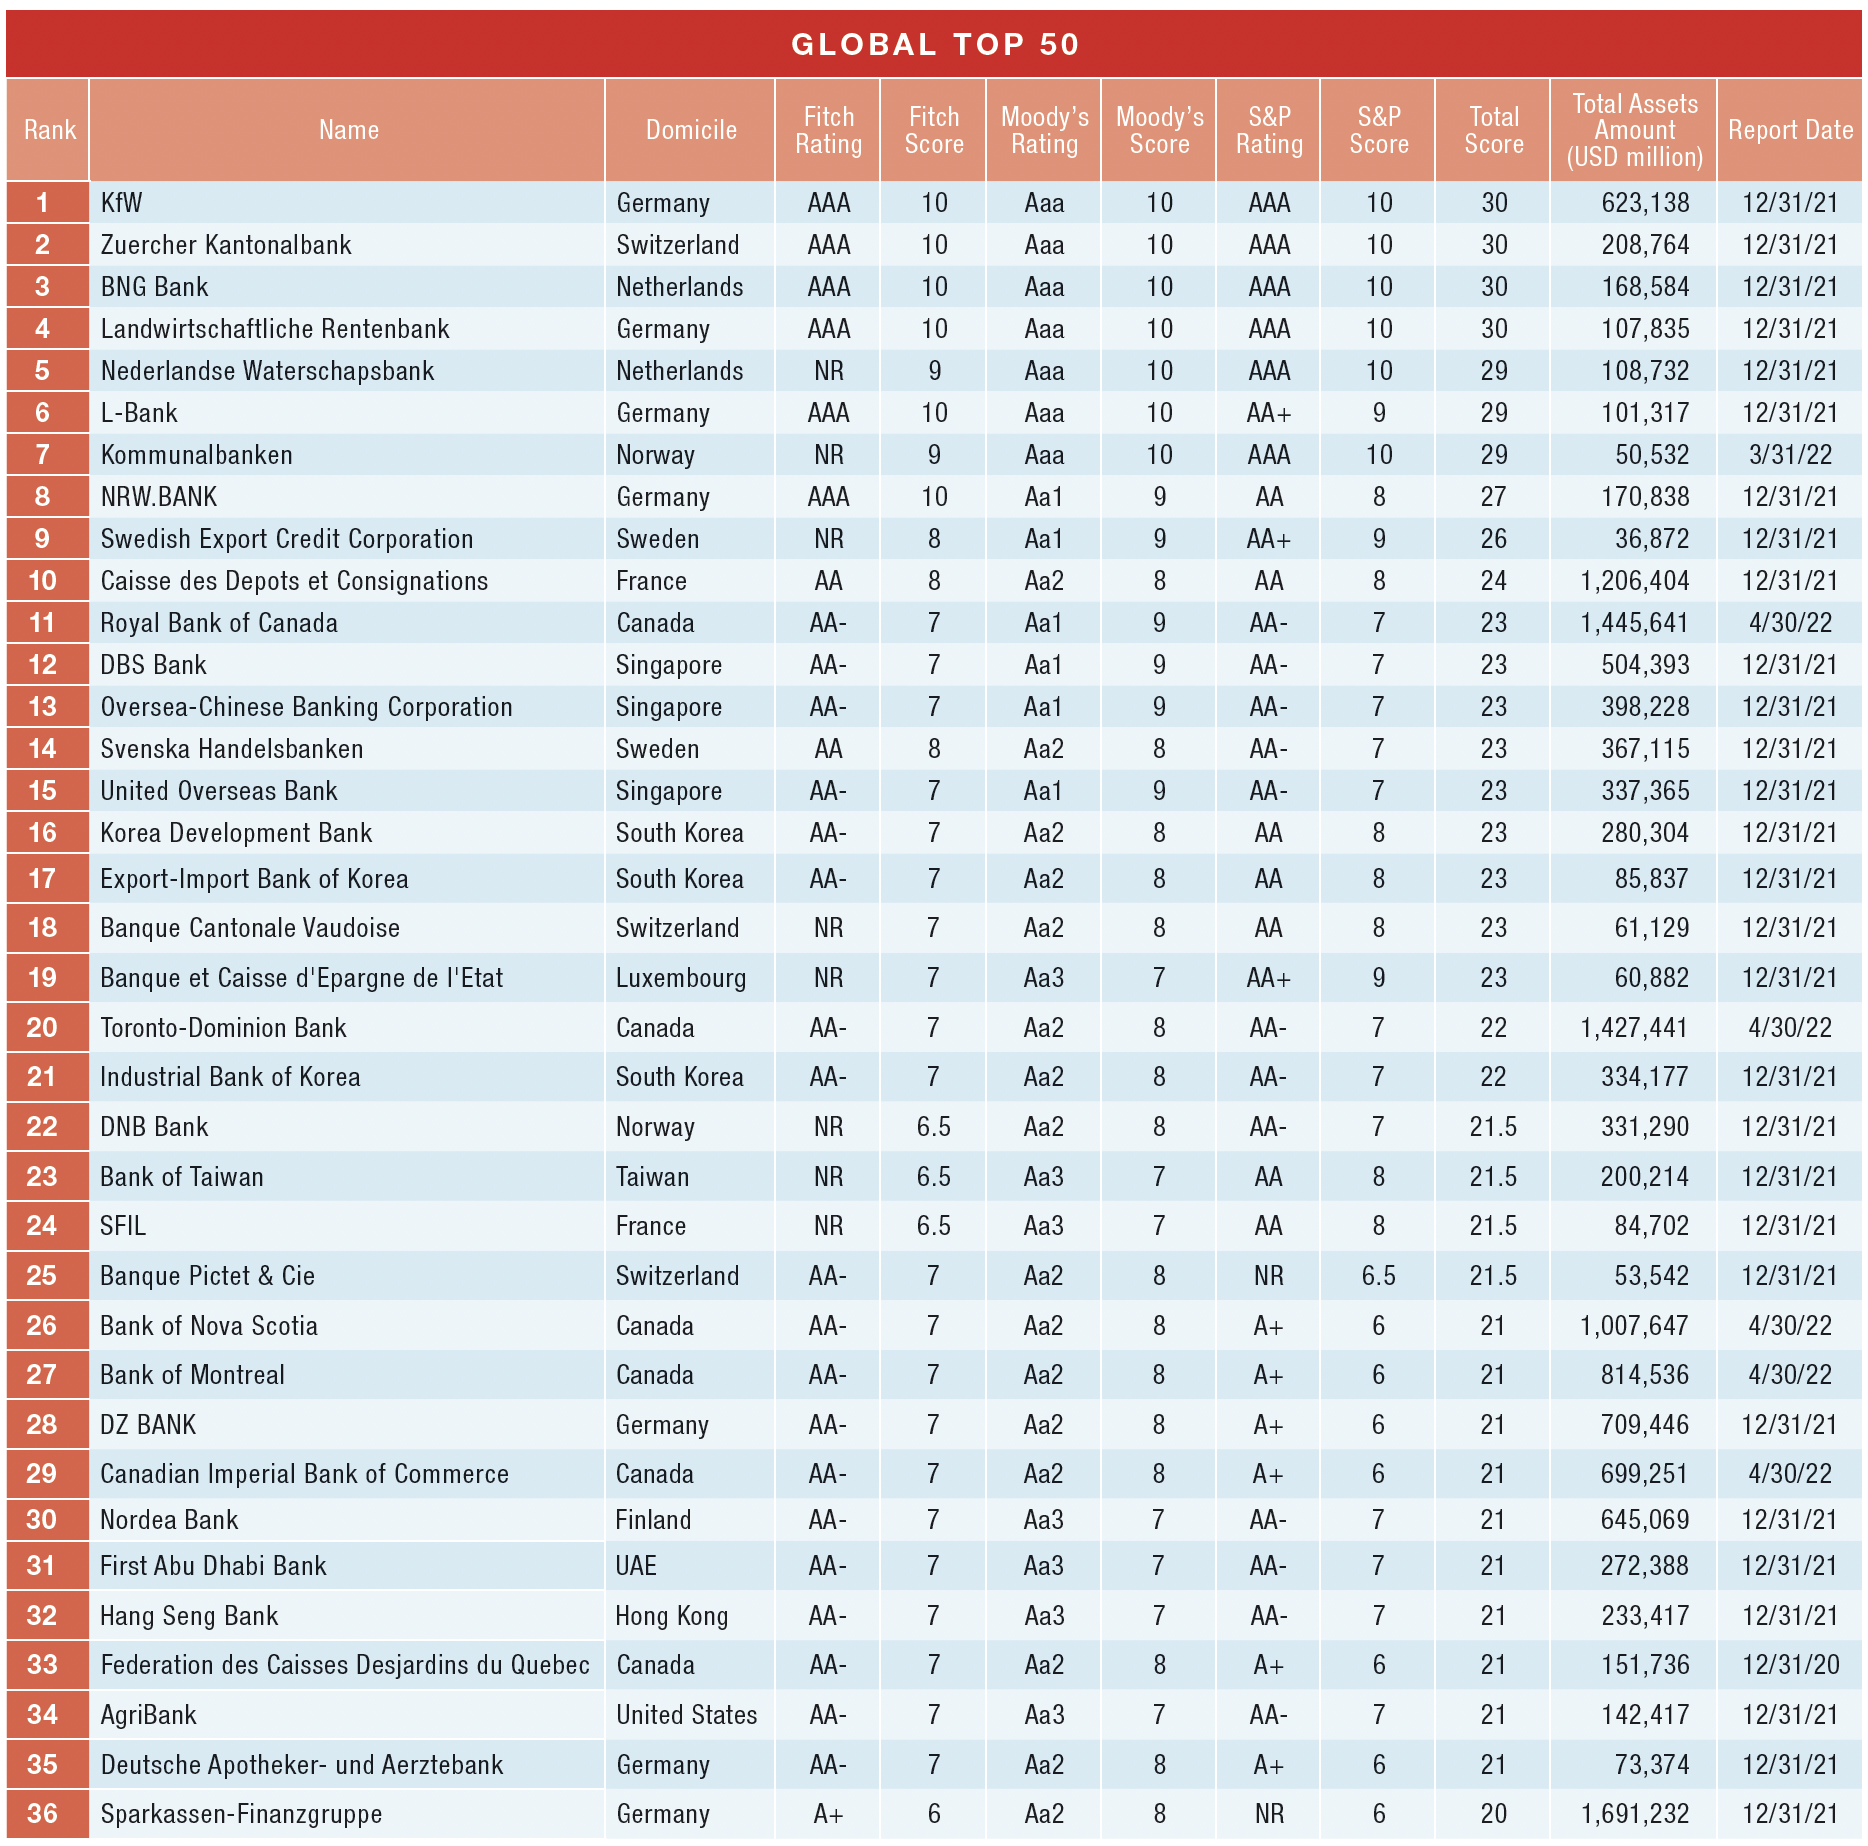
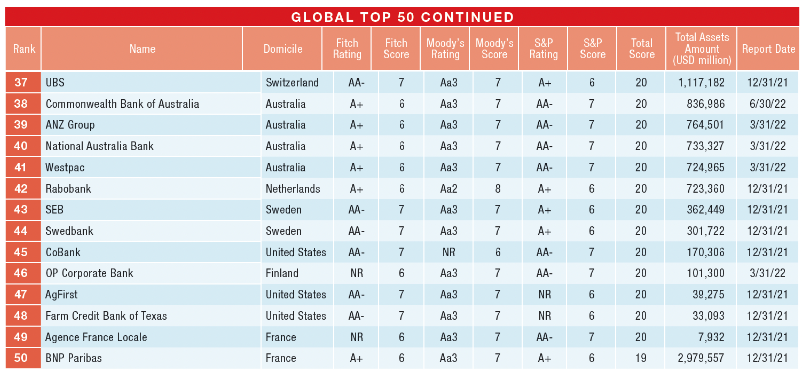
Source: World’s Safest Banks 2022, Global Finance
A few observations:
- All the 5 major Canadian banks are in this list.
- The 4 US banks in the ranking are relatively unknown – AgriBank, CoBank, AgFirst and Farm Credit Bank of Texas. All four are part of the US Farm Credit System.
- Similarly the 4 major banks of Australia also made it to the list.
- Interestingly Credit Suisse of Switzerland did not make the cut but UBS (UBS) did.
Disclosure: Long RY