Stock buybacks are generally not beneficial to most investors.Many studies have shown that companies that buy their own stock do not perform well in the long run. Buybacks are mainly an accounting trick to manipulate stocks prices. When companies engage in buybacks their timing is usually bad too. For example, just before crash due to the global financial crisis, buybacks by U.S. firms reached record highs.
In some instances, buybacks can be successful in terms of propelling stock prices higher and higher not just in the short-term but in the long-term as well. US-based auto-parts retailer Autozone(AZO) is a perfect example of this scenario.
Autozone’s stock price closed at $673.62 on Friday and the company has market capitalization of $21.0 billion. The shares outstanding stands at just over 31 million. According to an article in The Wall Street recently, the company has been consistently buying its own shares since 1998.
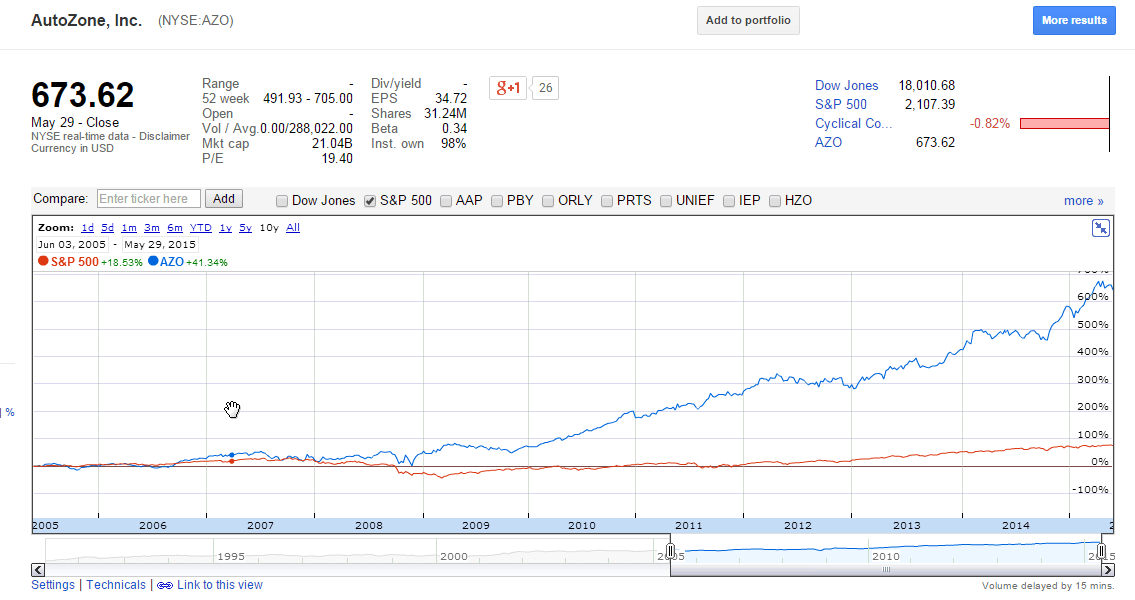
The following chart shows Autozone’s stock price over the past 10 years and all-time:
Click to enlarge
10-year return chart:
All-time return chart:
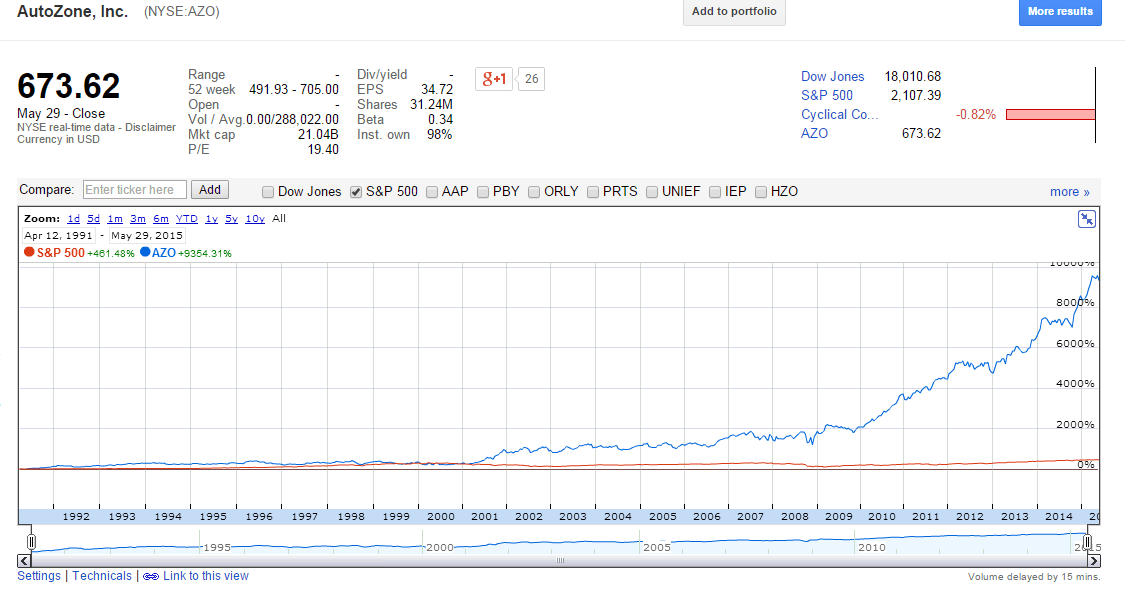
Source: Google Finance
In the past 10 years, AZO is up by an astonishing 643% relative to S&P’s rise of just 77%. The difference in the long-term returns are even more fabulous as shown in the chart above.
Here are few more interesting facts from the Journal piece:
- Since 1998 Autozone has reduced its share count by four-fifths.
- An original investment at the time of Autzone’s IPO would have now grown by more than 93 times.
- Autozone’s stock has become expensive as the P/E ratio has grown 12.52 in 2011 to 17.7 now.
- The firm has reduced its shares outstanding by a net of nearly 10% annually.
Source: Buybacks Alone Won’t Fuel AutoZone, The Wall Street Journal, May 25, 2015.
The impact of all the buybacks are reflected in the share price as it has consistently grown over the years. The key takeaway is that buybacks can work in rare cases such as this one. It should not be noted that Autozone does not pay a dividend. So investors are purely betting on capital appreciation. Hence the stock may not be suitable for income investors.
In addition, Autozone operates in a consumer staples-type industry since auto-parts are a stable business during economic expansions and contractions. During recessions consumers tend to maintain their existing automobiles by buying parts as opposed to buying new cars. Hence auto-parts benefit from this trend.
Disclosure: No Positions
Related:
- AutoZone: Do You Prefer Repurchases Or Dividends? (Seeking Alpha)