Households in India have very low exposure to equities in terms of their financial holdings. In fact, a recent article in The Wall Street Journal noted that Indians have about 2% of their total financial assets in stocks. This is very low compared to other countries such as the U.S. where the rate is 35%.
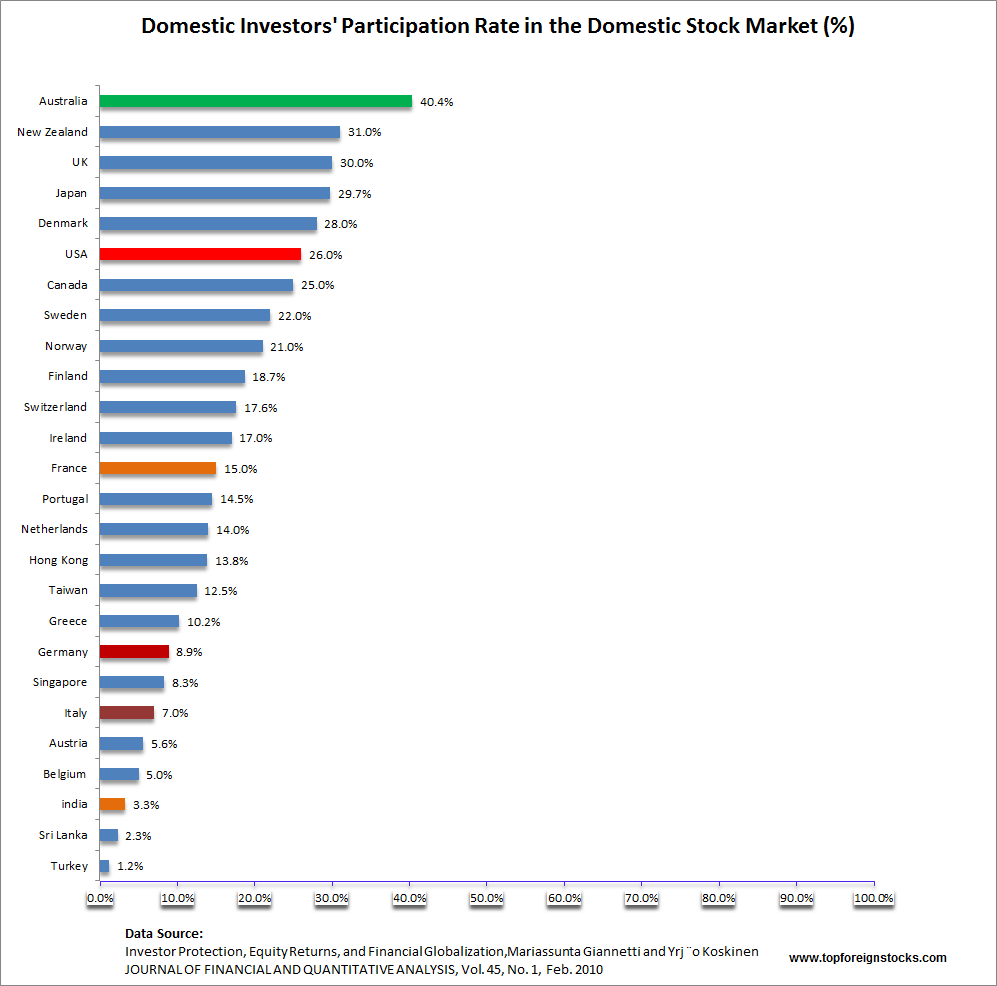
It is not just that Indian households’ asset allocation to stocks is very low but also the participation rate of domestic investors is low as well. Only 3.3% of households participate in the equity market. Here is a chart I posted back in 2013 on stock market participation rates across countries:
Click to enlarge
Sources:
Stock Market Participation Rates Across Countries, TFS, January 20, 2013
India’s Domestic Investors Add Fuel to Stocks, WSJ, June 17, 2015