Dividend stocks offer cushion to a portfolio during volatile market conditions such as the one we are seeing now while helping to grow the portfolio steadily when markets are strong. Investing in stocks that pay no dividends is highly risky since one is betting on pure price appreciation which may or may not happen. Studies have shown over and over again that dividend payers handily beat non-payers over time. Here is a chart that shows the importance of dividends to total returns based on the S&P 500:
Click to enlarge
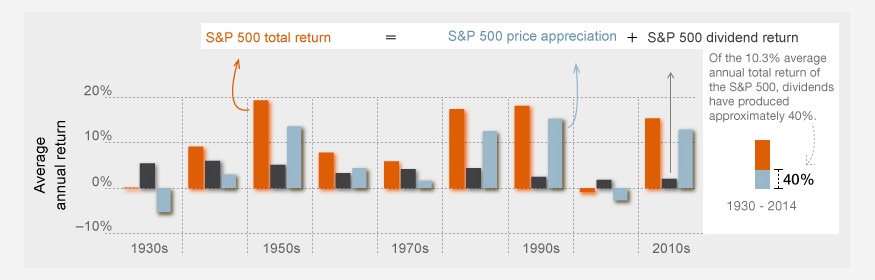
Source: Case for dividend stocks now, Fidelity, 8/12/15