The media and the certain sections of public generally focus on macro economic indicators such as GDP in order to discuss the well-being of a country. But how do all the over-hyped figures such as the GDP, GDP Growth Rate, etc. impact the average person on Main Street is important. For instance, the US economy is the largest in the world at over $16.0 Trillion and the GDP per capita is over $53,000. These figures do not mean much when the number of people surviving on food stamps is growing, wages are stagnant, people are unhappy, debt levels are soaring again, crime rates are increasing, etc. In this post, lets take a look at three charts on the current state of households in Germany. Looking at data at the household level shows the real impact of economic growth or lack there of based on a report by the OECD.
1. German Real GDP and Real Household Disposable Income per Capita:
Click to enlarge
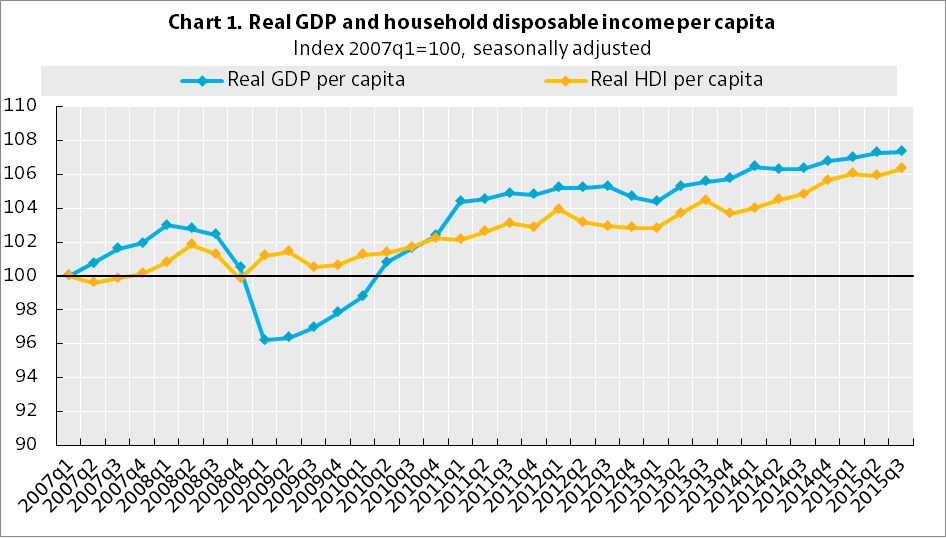
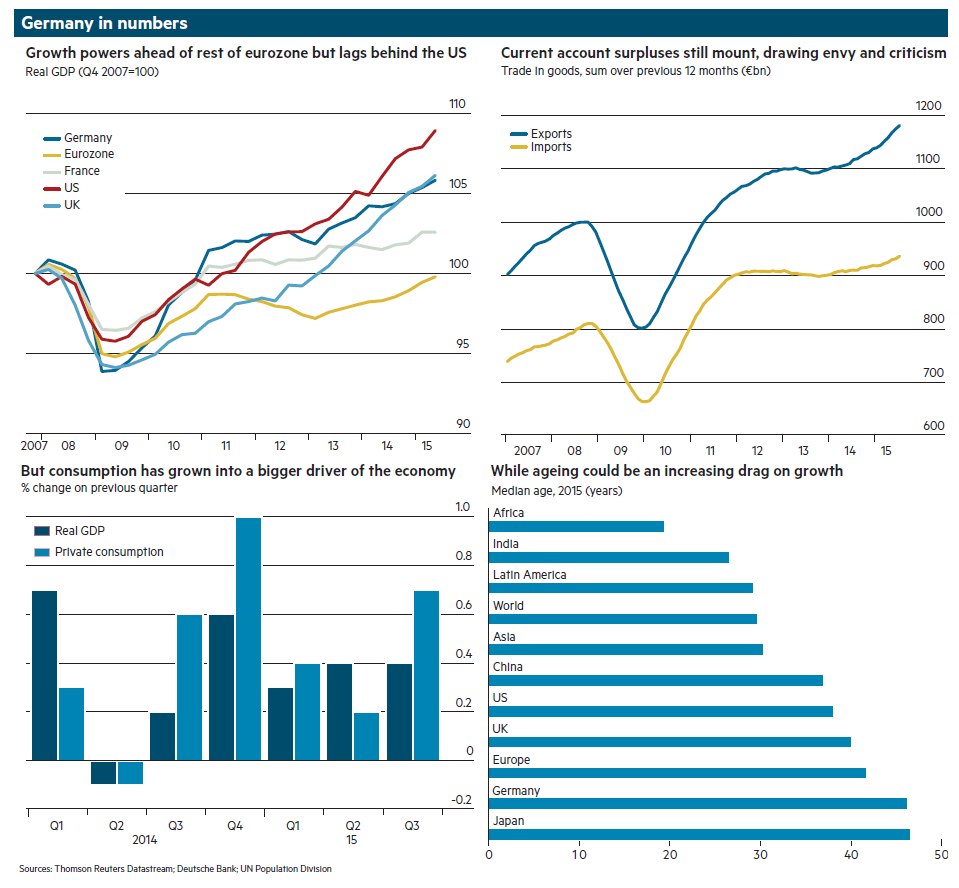
The above chart shows the development of real GDP per capita and real household disposable income per capita since the first quarter of 2007.Both the figures have steadily increased over the years which is good for the economy as a whole.
2. German Household Savings Rate:
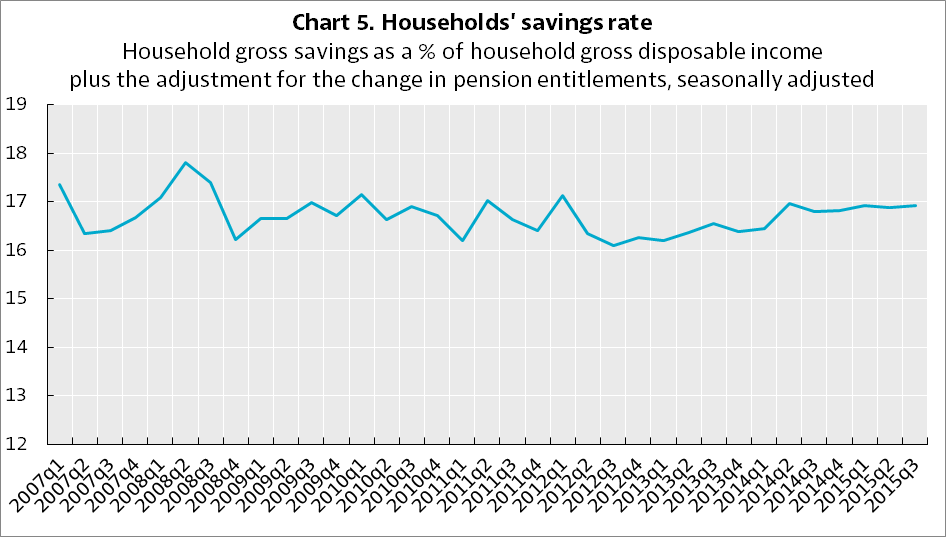
Germans are big savers and not spenders. Unlike the US economy which is a consumption-based Germany’s economy is export-driven. The household savings rate in Germany was 16.9% in 3Q, 2015 and the average rate is 16.7. The rate is not only high among OECD nations but also highly stable. The latest US personal saving rate is just 5.2% according to St.Louis Fed.
3.German Households’ Indebtedness:
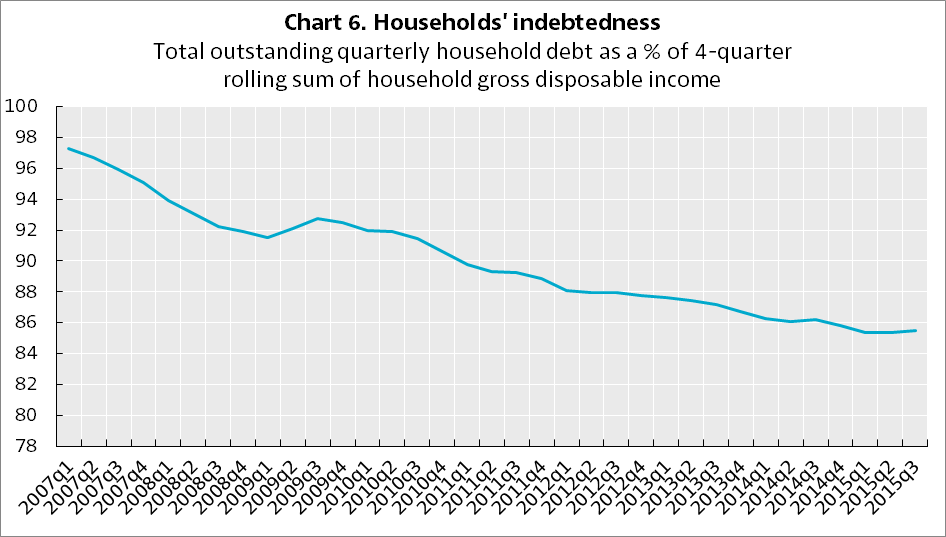
The chart shows a consistent decline in the indebtedness of German households. One does not need a Ph.D in Economics to understand that lower debt levels are a big positive factor for households.
4. German Unemployment Rate:
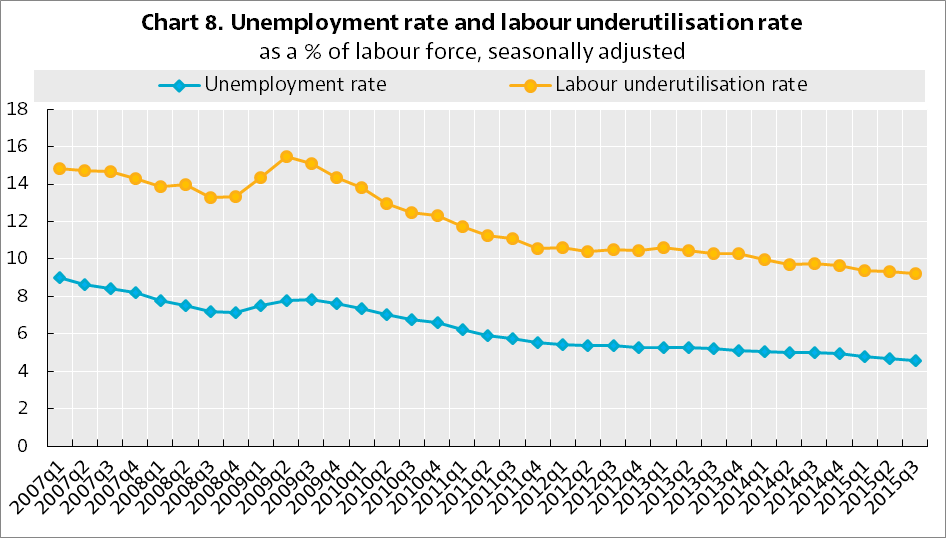
High unemployment rates lead to distressed households. The German unemployment rate stood at 4.6% in 3Q, 2015 the lowest level since 1991. In January, the rate has dipped further to 4.3% according to DeStatis.
Source: A dash of data: Spotlight on German households, OECD Insights