Investors tend to focus on cash held by US corporations rather than their outstanding debts. All too often investors analyze and wonder about all the cash and cash equivalents held by large US firms. Every now and then the media also publishes a report on the cash pile that American corporations are hoarding within the country and also overseas. Cash held by US firms in foreign countries get more attention as supposedly they are unwilling to repatriate the funds to the US due to heavy tax burden imposed by the government. As a result, the story goes, that billions of dollars languish abroad in many tax havens or simply lie unused for any productive purpose.
Instead of focusing on the cash held, investors should be more worried by the debt mountain that American firms have built over the years. This outstanding debt runs in the Trillions and continues to grow year after year. The availability of cheap funds only encourages these firms to gorge on more debt even when they do not have any investment planned for the funds.
The chart below shows the top 10 firms by cash held:
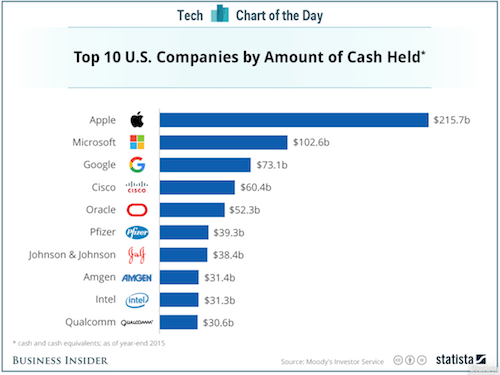
Source: Business Insider via Vestact
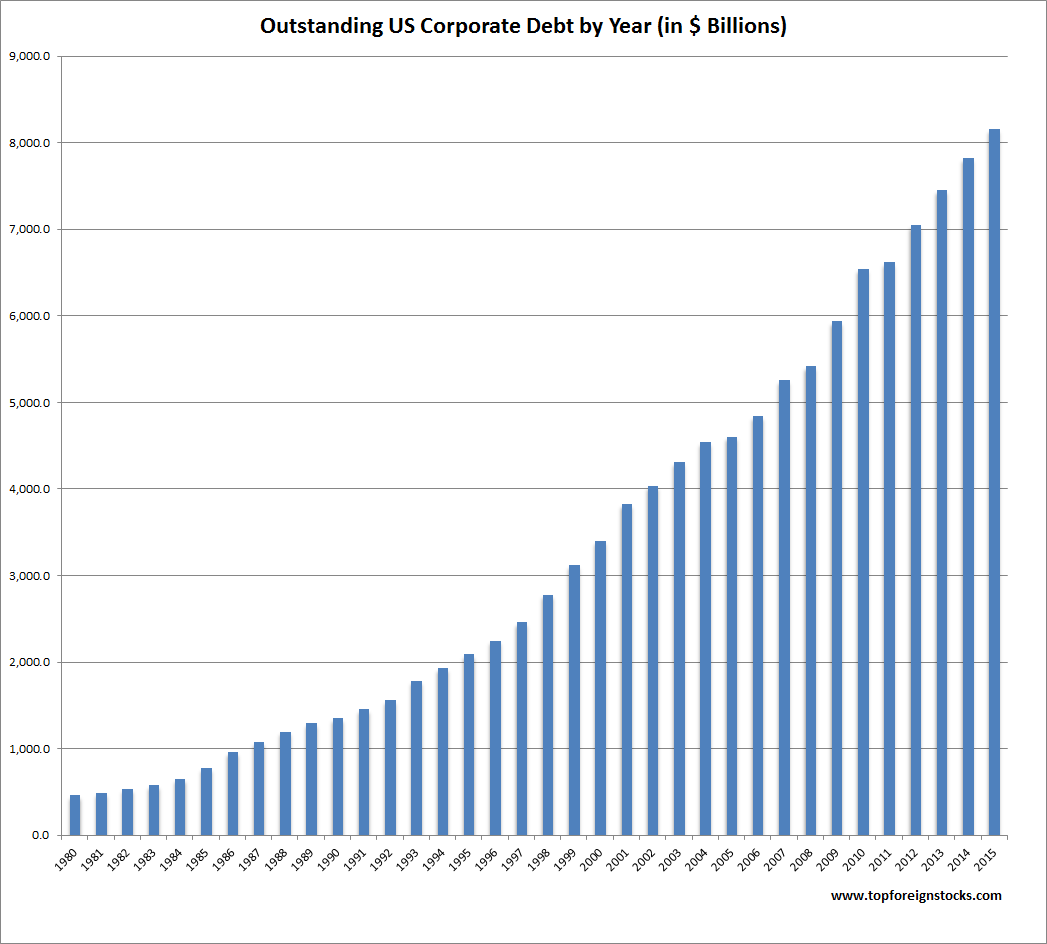
The above chart shows only one side of the equation. As mentioned above the debt held by companies is much higher than the cash held. The following chart shows the total outstanding US corporate debt by year:
Click to enlarge
Source: SIFMA
Since the global financial crisis, ultra-low rates, have led to soaring debt levels. At the end of 2015, this debt figure stood at over $8.1 Trillion.
One way corporate America is taking advantage of cheap money is to issue debt and use the funds to pay as dividends to equity investors or buy back own shares to increase the stock price. This strategy is being played out when earnings are substantially down and nowhere near pre-crisis levels. So in a nutshell, though profits are down companies are able to create the illusion that everything is great by simply borrowing money to keep equity investors happy.
Leverage by US corporations is also rising according to a January article at Bloomberg. From the article:
There’s been endless speculation in recent weeks about whether the U.S., and the whole world for that matter, are about to sink into recession. Underpinning much of the angst is an unprecedented $29 trillion corporate bond binge that has left many companies more indebted than ever.
Whether this debt overhang proves to be a catalyst for recession or not, one thing is clear in talking to credit-market observers: It’s a problem that won’t go away any time soon.
Strains are emerging in just about every corner of the global credit market. Credit-rating downgrades account for the biggest chunk of ratings actions since 2009; corporate leverage is at a 12-year high; and perhaps most worrisome, growing numbers of companies — one third globally — are failing to generate high enough returns on investments to cover their cost of funding. Pooled together into a single snapshot, the data points show how the seven-year-old global growth model based on cheap credit from central banks is running out of steam.
“We’ve never been in a cycle quite like this,” said Bonnie Baha, a money manager at DoubleLine Capital in Los Angeles, which oversees more than $80 billion. “It’s setting up for an unhappy turn.”
Here is an excerpt on buyback programs and earnings decline from a report by Niels C. Jensen at Absolute Return Partners of UK:
Excessive stock buy-back programmes
The next one is one we all know about – stock buy-back programmes. Buying back your own company’s shares enhances EPS in the short term, which is typically rewarded by investors here and now. Take the U.S., where buy-backs totalled $1.1 trillion last year. The flipside of that is a deteriorating capital stock. Companies under-invest as a consequence of spending their free cash flow (and sometimes more) on buying back shares and, as a result, the capital stock ages, and it shrinks. Private, domestic investments, measured as a % of GDP, are now at the lowest point for the past 60+ years. Under-investing today reduces profitability tomorrow, and the extraordinarily low U.S. private, domestic investments therefore paint a very dark picture for the profitability outlook of the U.S. corporate sector.Meanwhile, U.S. corporates are leaving investors with an illusion of improved profitability, but the true story is quite different. Whereas S&P 500 EPS rose marginally from 2014 to 2015, ‘proper’ earnings (GAAP earnings) actually dropped almost 15%. That is likely to come back and bite investors in the derriere at some point.
Source: The Absolute Return Letter, May 2016, Absolute Return Partners
