US equity investors looking for growth stocks can consider opportunities south of the border, Though Mexico is usually avoided by the investment community due to political risk, violence, etc. there are many factors that favor investment in the country’s equity markets. For example, unlike other Latin American economies such as Brazil or Chile, Mexico’s economy is not dependent on commodities and is highly related to the US economy.So when the US economy grows Mexican economy also expands. Due to a strong manufacturing sector and a growing middle class Mexico is on par with other fast growing economies.
The benchmark IPC All-Share Index is ahead of the S&P 500 with a gain of over 9% year-to-date.
Listed below are six Mexican stocks trading on the US markets:
1.Company: Coca-Cola Femsa SAB de CV (KOF)
Current Dividend Yield: 3.86%
Sector: Beverages
2.Company: Grupo Aeroportuario del Centro Norte SAB de CV (OMAB)
Current Dividend Yield: 10.30%
Sector: Airport Operator
3.Company: Grupo Aeroportuario del Pacifico SAB de CV (PAC)
Current Dividend Yield: 2.82%
Sector: Airport Operator
4.Company: Grupo Aeroportuario del Sureste SAB de CV (ASR)
Current Dividend Yield: 1.94%
Sector: Airport Operator
5.Company: Fomento Economico Mexicano SAB de CV (FMX)
Current Dividend Yield: 1.52%
Sector: Beverages
6.Company: Kimberly-Clark de Mexico SAB de CV (KCDMY)
Current Dividend Yield: 3.78%
Sector: Household Goods
The three airport operators have excellent growth potential due to the high tourist traffic flowing to Mexico’s beach destinations. Unlike airlines airport operators have high profit margins and have a variety of revenues sources such as car parking lots, shops, restaurants, advertisements, etc.
Note: Dividend yields noted above are as of Aug 4, 2016. Data is known to be accurate from sources used.Please use your own due diligence before making any investment decisions.
Disclosure: No positions
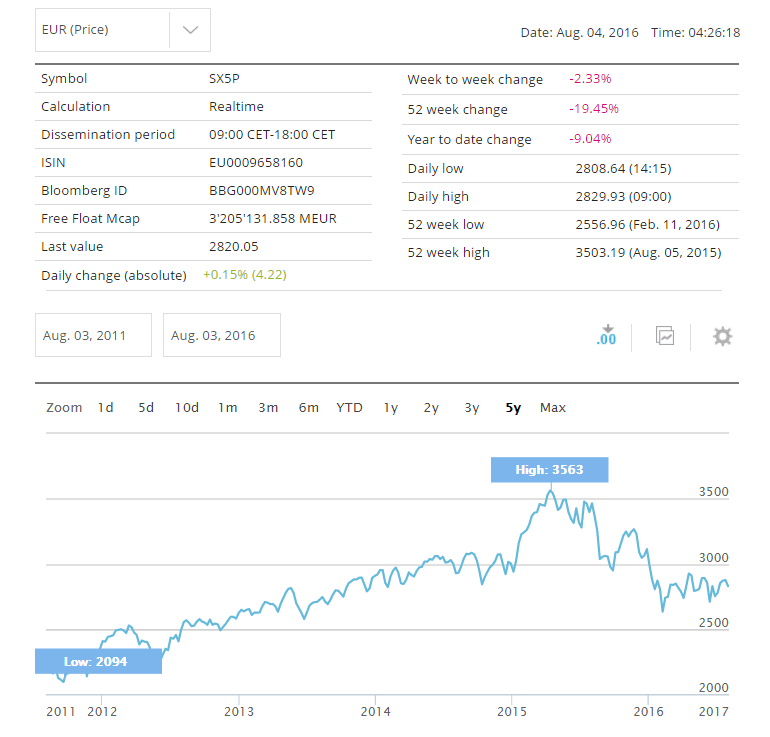
Click to enlarge

A beach in Cancun, Mexico