U.S. stocks are expensive based on the forward P/E ratio. According to Factset, the current ratio of 17.6 is higher than the averages reached in 5, 10, 15 and 20 years.
Click to enlarge
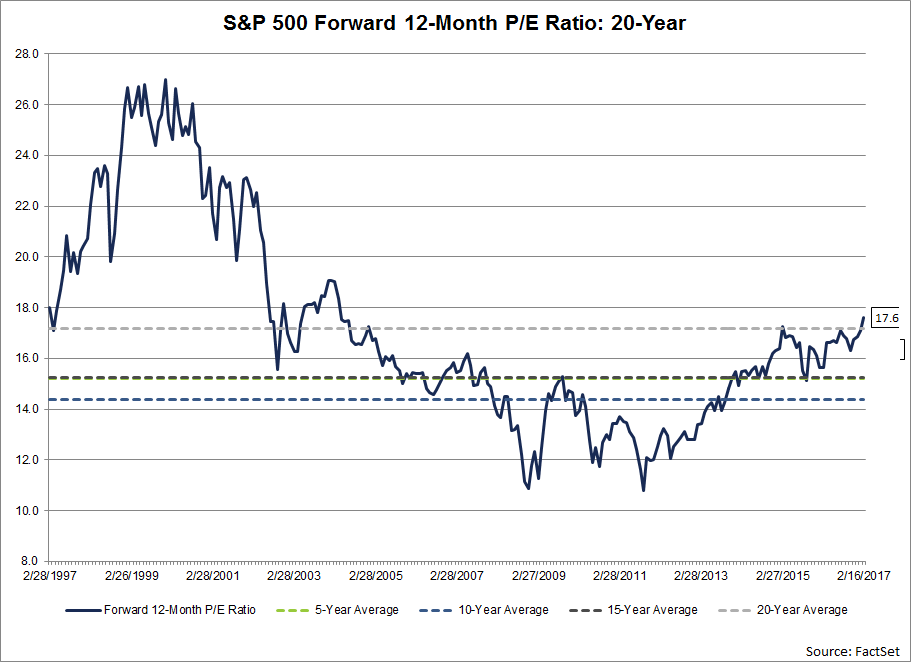
Source: Factset
U.S. stocks are expensive based on the forward P/E ratio. According to Factset, the current ratio of 17.6 is higher than the averages reached in 5, 10, 15 and 20 years.
Click to enlarge
Source: Factset
One of the topics that I have written many times on this blog is the concept of Market Timing. This strategy involves selling at market peaks and buying at market lows. While this sounds pretty simple, obviously it is impossible to execute for any investor. If it was so easy to do, then everyone will be making money in the equity market. Even professional money managers playing with other people’s money fail in timing the market. Since it is very important for retail investors to avoid trying to identify the market tops and bottoms and execute trades accordingly let me discuss why market timing never works in this post using the example of the British equity market.
The following chart from an article by Rory McPherson at pSigma, UK shows the adverse impacts of market timing in the British market:
Click to enlarge
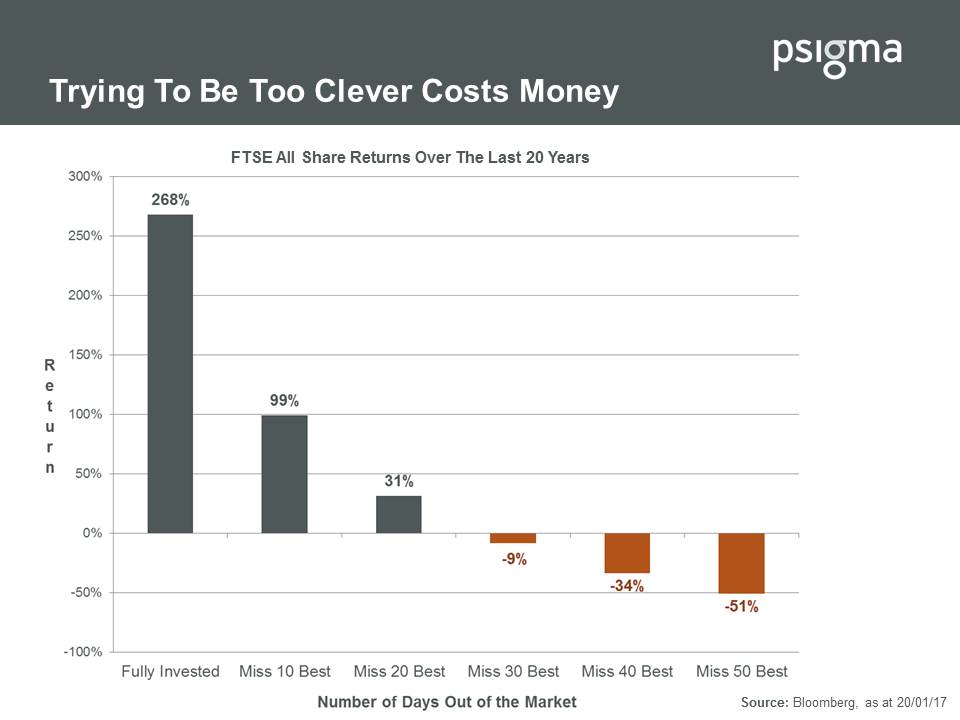
Slide3
Source: Asset Allocation – “Keep Calm and Stick to the Plan…”, pSigma Hat-tip: Money Observer
Mr.Rory noted the astonishing fact:
As the chart above shows, missing the best ten days of performance in the last twenty years of UK stock market returns would have cost you 170%! In fact, if you’d missed the best thirty days returns then you’d have lost money over that twenty-year period instead of almost tripling your wealth. (emphasis mine)
The more best days of the market an investor misses, the worst their returns are.
Note the returns shown above are for the FTSE All Share Index and not the popular FTSE 100.
So in a nutshell, retail investors should not try to time the market.Instead investors are better of holding a diversified portfolio thru the market’s roller-coaster days.
Below are some of the recent geo-political events that shook investors’ confidence:
All thru these crises markets continued to move forward and today many global markets including the US are in record territory.
Below is an excerpt from an article at MarketWatch on market timing:
If you had a crystal ball and knew that a peaking stock market was about to drop 30%, what would you do?
About a week ago I found myself talking about retirement planning with a fellow saver who confidently offered: Stop contributing to your 401(k). They argued that it’s better to wait for the market to tumble then get back to contributing to a retirement savings plan because much of what you save now will be eroded by the market crash.
There are compelling reasons to conclude that the stock market is near its peak. The S&P 500 SPX, +0.50% which has been rising since early 2009, is up 26% over the past 12 months, trading at all-time highs. It is, by many measures, at very stretched valuations. The cyclically adjusted price-to-earnings ratio, or CAPE, at 29 is at extreme levels, seen only twice over the past century, in 2000 and 1929.
Source: Here’s why market timing is bad for your retirement goals, MarketWatch
The widely used benchmark for emerging markets from provider MSCI has changed substantially in recent years. As emerging markets evolve the index weightings changes accordingly.
The graphic below shows the comparison of country and sector weights of the MSCI Emerging Markets Index in 2008 and 2016:
Click to enlarge
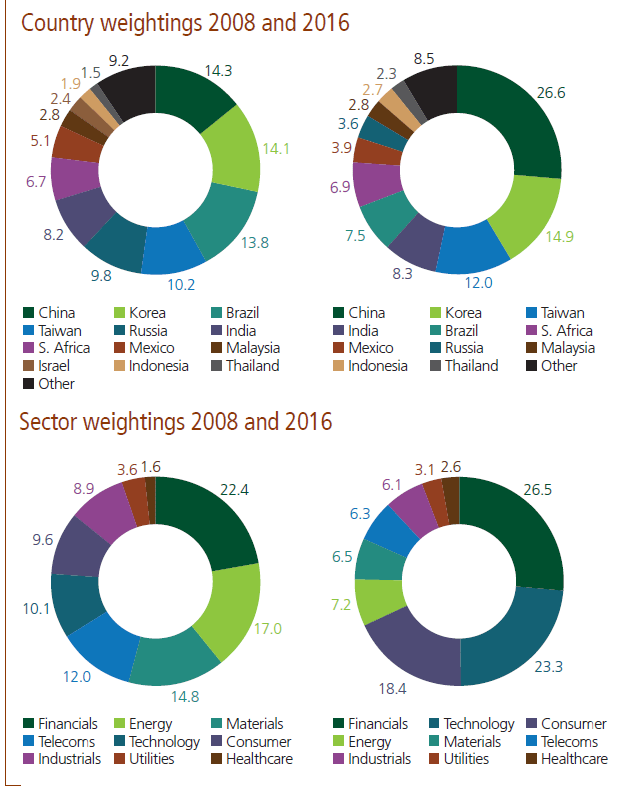
Source: Active Viewpoint: Global Emerging Markets, Martin Currie
Financials have maintained about the same allocation in 2008 and 2016 but materials and energy sector weights have declined in the index. However the weighing of the technology sector rose 130% between the years.
MSCI Emerging Markets Index Composition in Jan, 2017:
Click to enlarge
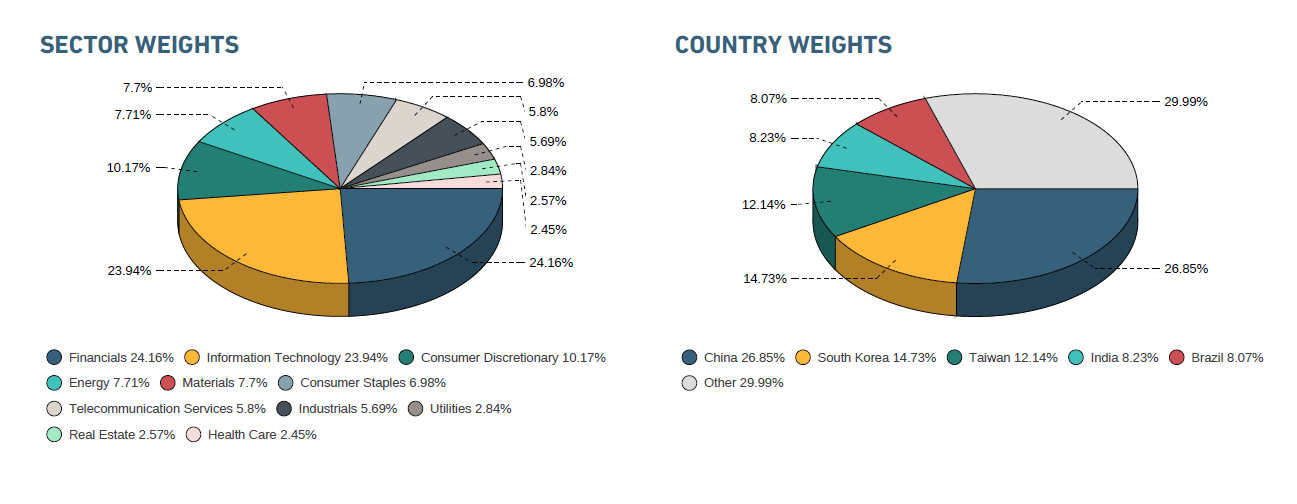
Source: MSCI
Energy and Materials still amount to about 7% of the index allocations.
The key takeaway is that developing countries are no more just for commodities and natural resources. Since these countries continue to develop some sectors will become more important and larger than others. According investors must adjust their portfolio allocations.
Related ETFs:
Disclosure: No Positions
Update (11/28/17):
Click to enlarge
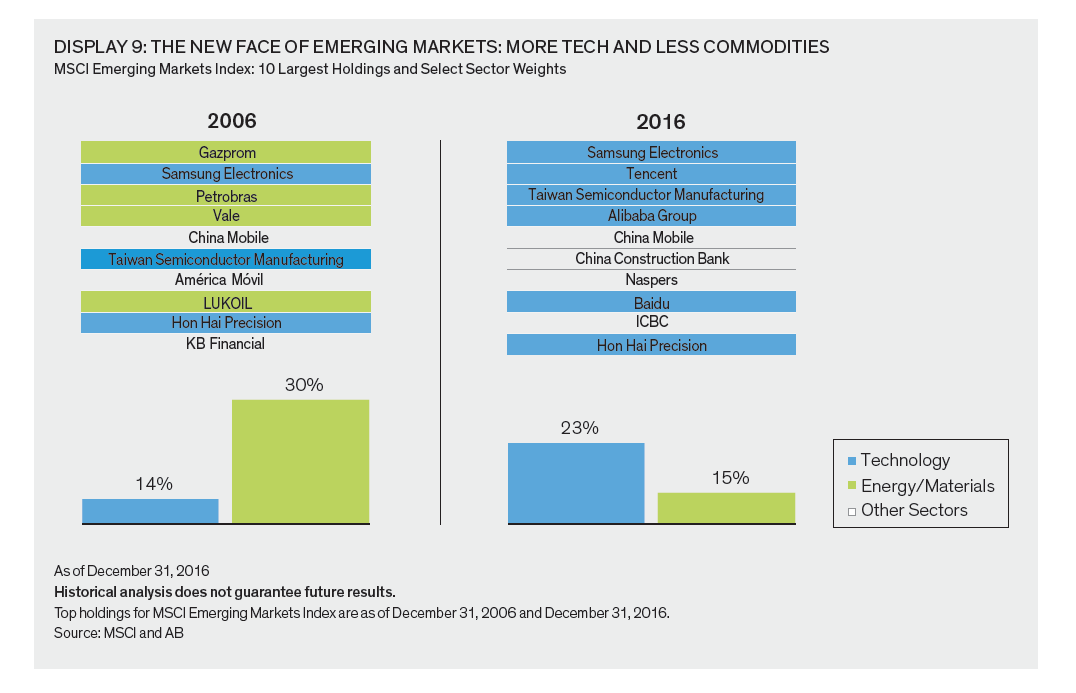
Source: Broaden your horizons, Alliance Bernstein, Oct, 2017
The benchmark index of the Indian equity market is the BSE Sensex Index. Though the Sensex is main index for Indian equities it is not the ideal index for many reasons. For example, emerging market investors such as those investing in Indian stocks invest to gain from the growth in the Indian economy.However investing in an ETF or a fund that tracks the performance of the Sensex is not the best way to capture the growth potential.
Simply put, Sensex is not the right representation of the Indian market.
Four flaws of the Senses index are discussed below:
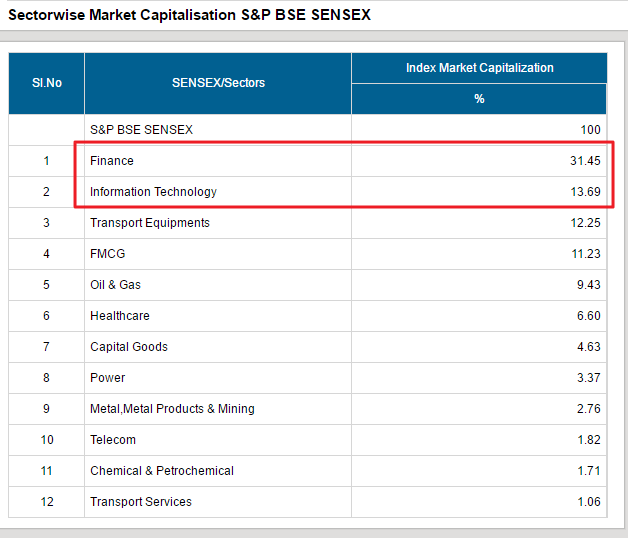
Source: BSE India
4.High Reliance on Foreign Markets: Many constituents in the Sensex derive a substantial portion of their revenue from foreign countries.This makes them dependent on the state of the overseas economies then India. For instance, IT outsourcers such as Infosys(INFY), Wipro(WIT) and TCS are heavily reliant on foreign companies for their earnings. So investing in their stocks does not mean one is betting on the growth of Indian middle class.Similarly Tata Steel and Tata Motors (TTM) have large overseas operations which impact their performance.
From an investment standpoint, it is important to research and pick individual stocks in emerging markets instead of simply going with an index tracker. Like with the Sensex example, an index may not serve the purpose of an investor looking to gain exposure and profit from the vast growth opportunities in those markets.
Related ETFs:
Disclosure: No Positions
The Periodic Table of Investment Returns for Asset Classes from 1997 thru 2016 is shown in the chart below. Last year Small Cap Value stocks were the best performers while international stocks were the worst performers. The last time foreign stocks had decent returns were before the Global Financial Crisis of 2008-09.
Click to enlarge
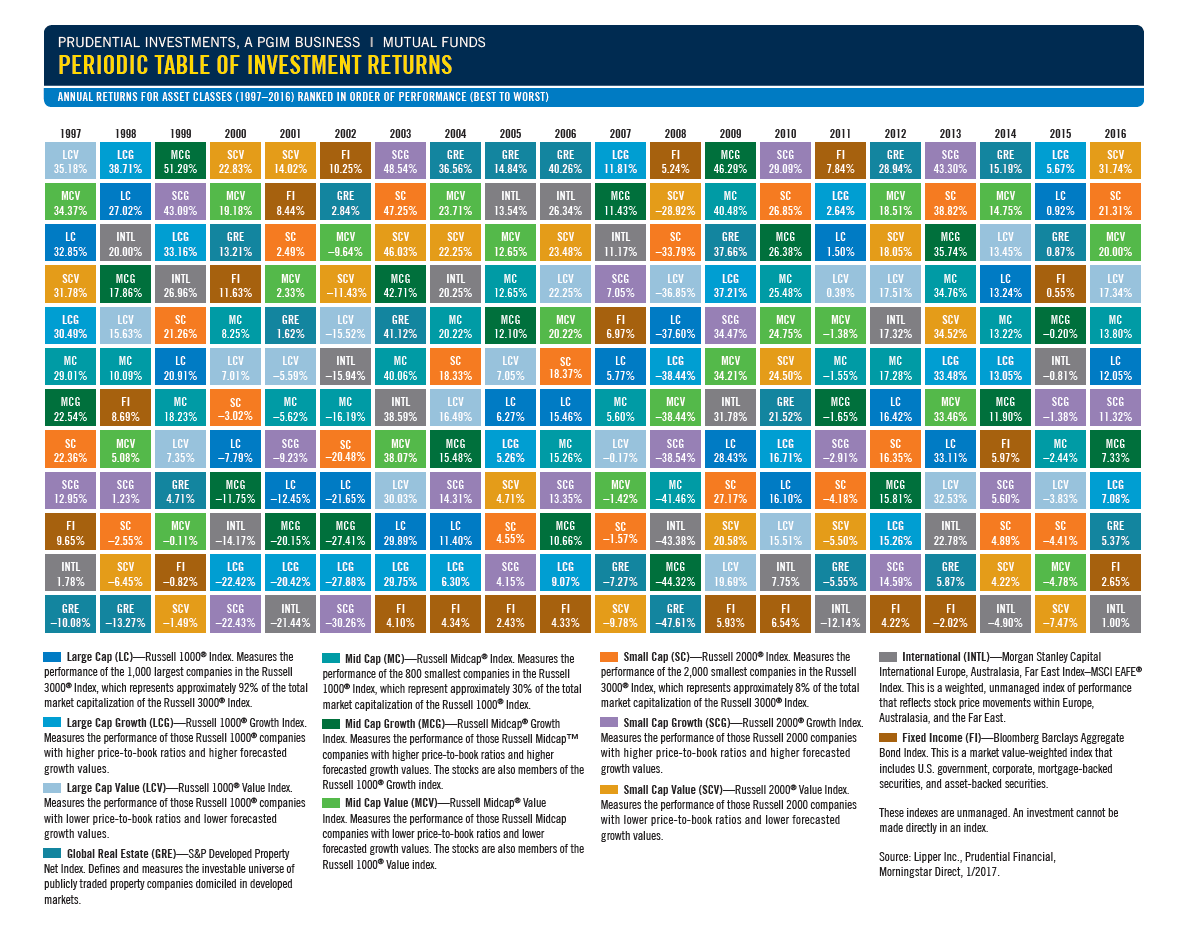
Source: Prudential