How Much Has Apple Stock Grown Since March 2009 ?

Last week marked  the 8th anniversary of the bull market that began in 2009 at the peak of the Global Financial Crisis. Since then the SS&P has soared by more than 260% with an annual average return of about 18% with dividends reinvested.

Apple(AAPL) stock has had a fantastic run that beat even the S&P 500’s 260%. Apple has surged more than 1,080 percent from early 2009 thru now.

Click to enlarge

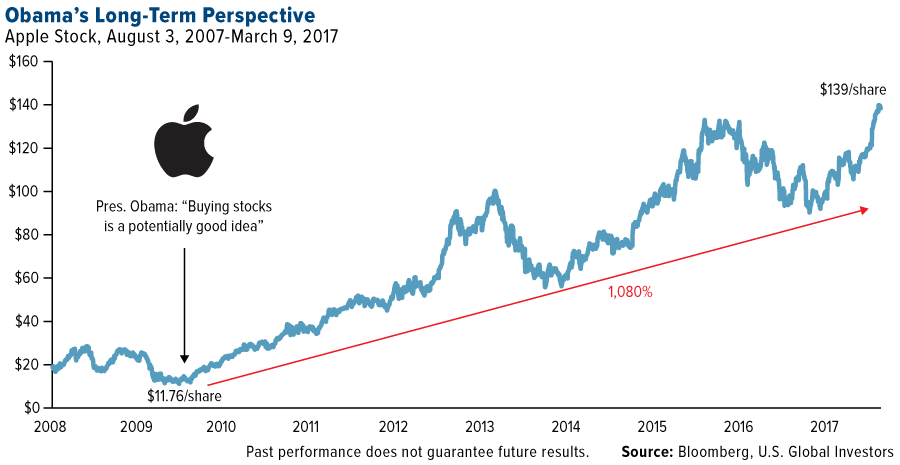
Source: U.S. Global Investors

By any measure this is an extraordinary growth. However the question now is: Can this type of growth occur in the future? Or was this a one-time wonder that may or may not happen moving forward.

Disclosure: No Positions

How To Obtain Real Diversification Benefits With Equities?

Diversification means holding various asset classes such as stocks, bonds, gold, cash, etc. across various geographical regions like developed, emerging, frontier markets. One cannot try to gain from diversification by simply owing an index fund or holding a bunch of stocks of the same asset class or type. For instance, owing a large-cap index fund or a portfolio of only large cap stocks is not the right way to diversify a portfolio. Large-cap stocks do not always perform better and earn a higher return than mid and cap stocks. So in order to diversify one’s portfolio it is wise to hold assets of all these types for the equity portion. In a recent article Jason Hollands of Tilney Group, UK discussed one way to obtain real diversification using the example of the benchmark indices for the UK equity market.

An excerpt from the piece:

I am however a big believer in genuine diversification, whether that is across asset classes, geographic markets, companies of different sizes and stages of development and indeed investment styles. Over the long run, both small and mid-cap shares have beaten the FTSE 100, convincingly so in the case of mid caps.

When you deconstruct the FTSE All Share index, the breakdown between its exposure to large, medium-sized and smaller company constituents by number of individual companies is radically different to what you end up with once market-cap weighting is applied as the following tables shows.

Index No. of companies FTSE All Share constituents (%) FTSE All Share market cap (%) Five-year total return (%)
FTSE 100 101 15.9 80.4 +51
FTSE 250 250 39.4 16.0 +93
FTSE Small Cap 284 44.7 3.6 +104
FTSE All Share 635 100 100 +57

Now here is a quick back of a fag packet piece of analysis: imagine if you had invested across these three parts of the market (large, mid sized and small) over the last five years in proportion to the number of constituents rather than based on market capitalisation.

Well, instead of getting the 57 per cent return delivered by the market-cap weighted FTSE All Share Index over this period, you’d be looking at something more like a 91 per cent return!

Source: The dangers of thinking FTSE 100 shares are safe, Money Observer, Feb 22, 2017

Note: All the returns shown above are in local currency (GBP)

Three reasons why small and mid-caps beat large caps in the long run are:

Large companies are generally considered safer than their smaller peers. Hence smaller companies grow faster and their stocks perform well as more risk means more rewards.

Many large firms are market leaders in their areas and they have been around for a long time. So they tend to be behind in innovation and usually are a huge bureaucratic mess.

Small companies can react to market changes quickly and hence reap the benefits whereas large companies cannot adjust to market changes fast.

So the key takeaway is that investors should not avoid mid and small cap stocks since large stocks alone can seem to offer plenty of diversification. But to generate a higher return and to benefit from the process of diversification it is important to hold all of the asset classes.

Related ETF:

  • iShares MSCI United Kingdom ETF (EWU)
  • iShares FTSE 250 UCITS ETF (MIDD)
  • iShares MSCI United Kingdom Small-Cap ETF (EWUS)

Disclosure: No Positions

Update: 

But see: Big Machine: Why Large Caps Are Likely to Outperform, Schwab

Knowledge is Power: South Africa, EU 2.0, Oil Stocks 2017 Edition


Wales, UK

U.S. Financials Look Inexpensive Now

Bank stocks have soared since the election of President Trump. Compared to the overall market banks are up by double digit percentages.For example, the Financial Select Sector SPDR® Fund ETF (XLF) is up by over 46% at the end of February with most of that return accumulated since the election. Compared to the S&P 500’s 5.63% year-to-date (YTD) return the fund is up 5.55% YTD. The reasons for the explosion of this sector are many including looser regulations, higher interest rates, etc.

So many investors may be wondering of financials have came off too far too fast and more importantly if they are cheap. According to two recent article they seem to be inexpensive now despite the tremendous run in the past few months.

From a Fidelity article:

How has the market reacted?

The market has realized that banks stand to benefit from many of the new administration’s prospective changes. But there’s still a lot of uncertainty. The real debate now is about how quickly and to what extent policy changes play out, and the extent to which policies other than those related to taxes and regulations, such as trade policy and foreign policy, affect the growth outlook and, in turn, the financials sector.

The stocks that have done best have been bank stocks, particularly those of U.S.-centric regional banks, highly regulated non-banks, and trading-oriented investment banks. This makes sense because return on equity—which is a key driver of valuation and stock performance—is poised to improve from depressed levels if these factors unfold favorably.

There are risks, of course. Foreign policy and global macroeconomic shocks associated with big policy changes may diminish investors’ appetite for risk, hurting stock prices. For example, if risk premiums rise because investors become anxious about changes in foreign policy, that could depress asset prices. Financial stocks would be very sensitive to these changes given the levered nature of their business models.

These stocks have also moved a lot, so there is a risk of buying when prices are high. It will depend on how much the expectations translate into improved earnings.

Source: What deregulation may mean for bank stocks, Fidelity

Here is another take on the sector from Russ Koesterich at Blackrock:

While some of the gains have come down to improvements in fundamentals, as with the broader market, much of the gains have been driven by more expensive valuations. The price-to-book ratio (P/B) on the sector is up over 40% from last summer’s lows. That said, valuations are still about 25% below the average since the early 1990s, although the P/B is now creeping back towards the post-crisis high.

Valuations look less pricey relative to the broader market, which may say more about extended U.S. stocks than cheap banks. Large cap banks are trading at a 60% discount to the broader market. This looks very reasonable against a 25-year horizon, during which the average discount was only around 40% (see the accompanying chart). However, as with absolute valuations, relative value is less enticing when compared to the post-crisis norm. Relative valuation for large U.S. banks is now back to the highest level since early 2014.

chart-relative-valuation-v2

He also notes that while bank stocks look cheap, from a Return on Assets (ROA) perspective they are still lower than before the financial crisis of 2008-09. The ROA was for large banks was 1.20% in 2006. Since 2011 it was at around 0.95% and has been even lower recently. So the ROA has not improved and returned to pre-crisis levels and the jump in bank stocks is mainly due to expectations for better times ahead.

Source: Are U.S. banks still cheap?, Blackrock Blog

Related:

  • SPDR Financial Select Sector ETF (XLF)

Disclosure: No Positions