Mexican airport operators have been one of the best performers until recently. On Oct 5th however they plunged dramatically when the Mexican government abruptly announced changes to the concession agreements which would reduce their revenues. The companies themselves have not released the specific details on how this change would impact them. Investors were not taking any chances and dumped the stocks leading to heavy losses. Grupo Aeroportuario del Centro Norte SAB de CV(OMAB) declined over 25% on the local market. Peers Grupo Aeroportuario del Pacifico SAB de CV (PAC) and Grupo Aeroportuario del Sureste SAB de CV (ASR) also fell heavily. The ADRs on these companies plunged even more than the local market. The YTD return chart shows the fall on Thursday:
Click to enlarge
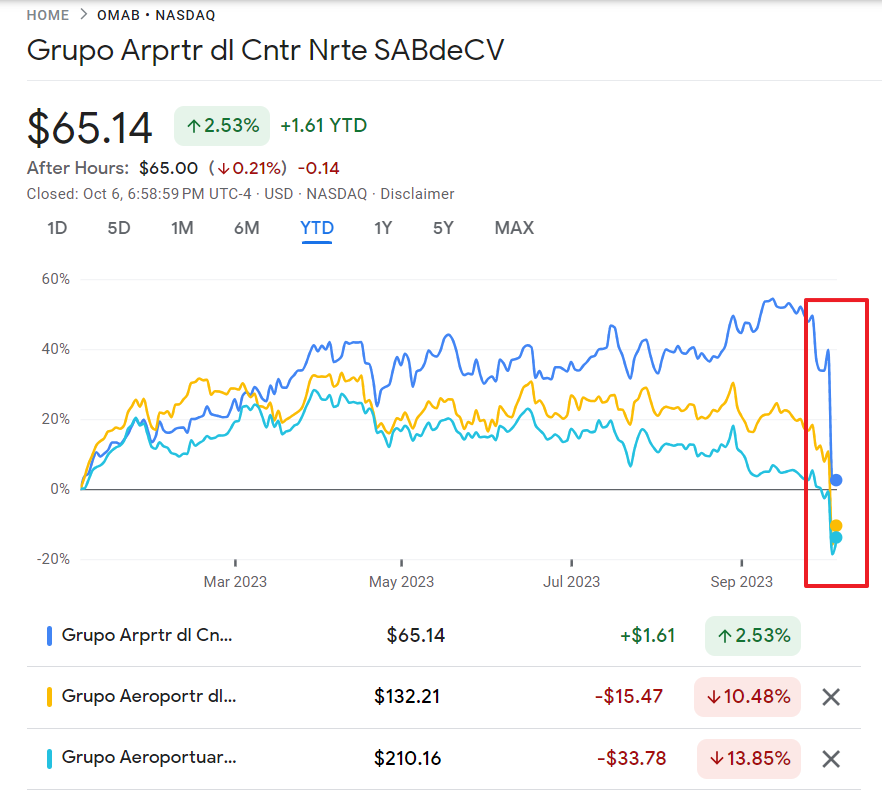
Source: Google Finance
The 5-year price returns of the stocks are shown in the following chart:
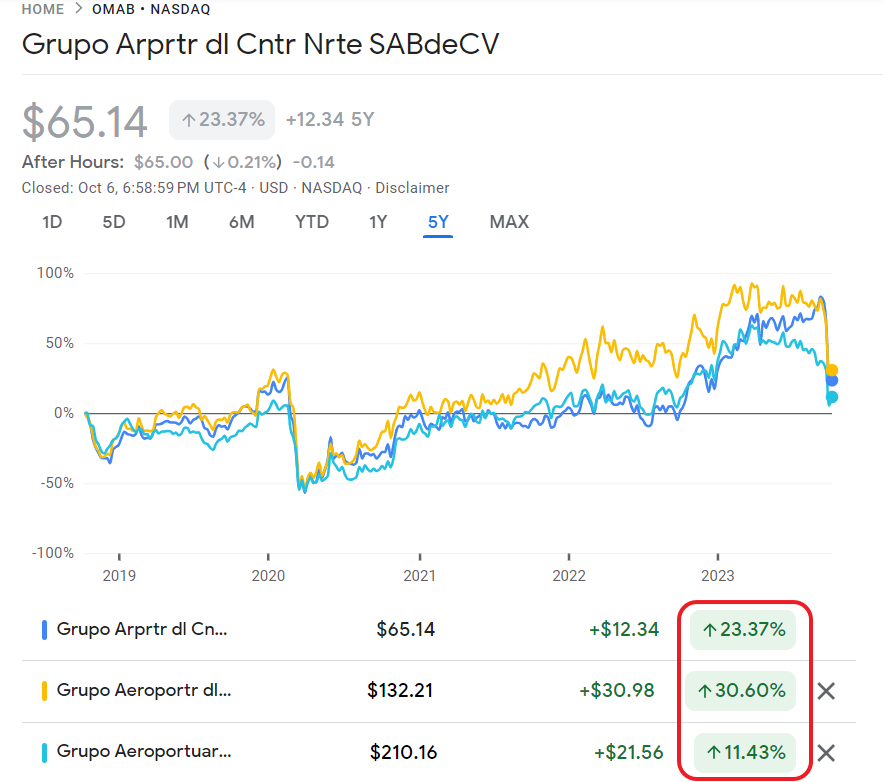
Source: Google Finance
Though the stocks recovered slightly on Friday, it remains to be seen how they fare the rest of the year and beyond. Any way one looks at this development, it is bad news for the companies. Abrupt changes in state policies are one of the risks investors face in emerging markets. This is a classic example.
Referenced stocks:
1.Grupo Aeroportuario del Centro Norte SAB de CV(OMAB)
52-Week High: $100.21
52-Week Low: $50.23
Closing Price on 10/6/23: $65.14
2.Grupo Aeroportuario del Pacifico SAB de CV (PAC)
52-Week High: $ 200.85
52-Week Low: $ 108.15
Closing Price on 10/6/23: $ 132.21
3.Grupo Aeroportuario del Sureste SAB de CV (ASR)
52-Week High: $ 314.48
52-Week Low: $ 165.00
Closing Price on 10/6/23: $ 210.16
Related:
Disclosure: No positions