Global Retirement Ages for Men and Women: Chart

The retirement ages for men and women vary widely across countries. In this post let us take a look at the ages differences between countries. But before we get to that, here is a brief introduction on retirement.

Germany was the first country in the world to implement an old age social insurance program back in 1889. German Chancellor Otto von Bismarck was the architect of this system and the retirement age was set at 70. Later it was reduced to 65 in 1916. In this perspective, Germany was far advanced in thinking about taking care of its senior citizens than over developed countries. The US followed Germany’s lead with its own social security system over four decades after Germany in 1935 with the retirement age set at 65. Other countries soon followed.

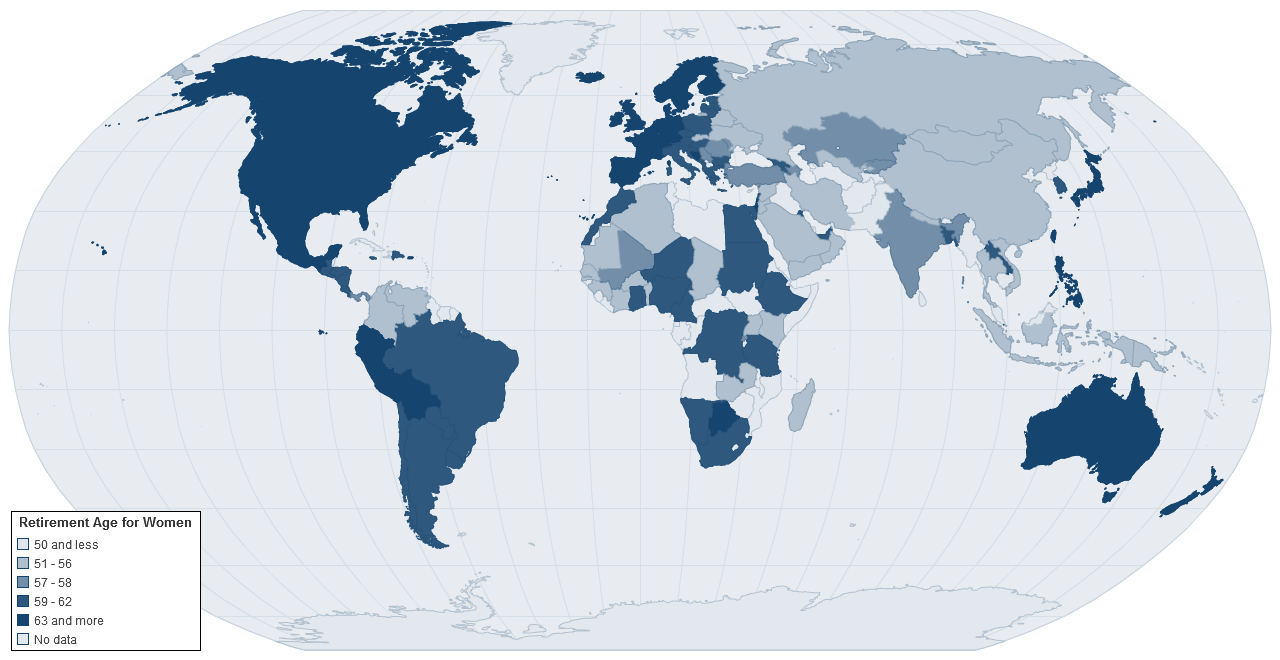
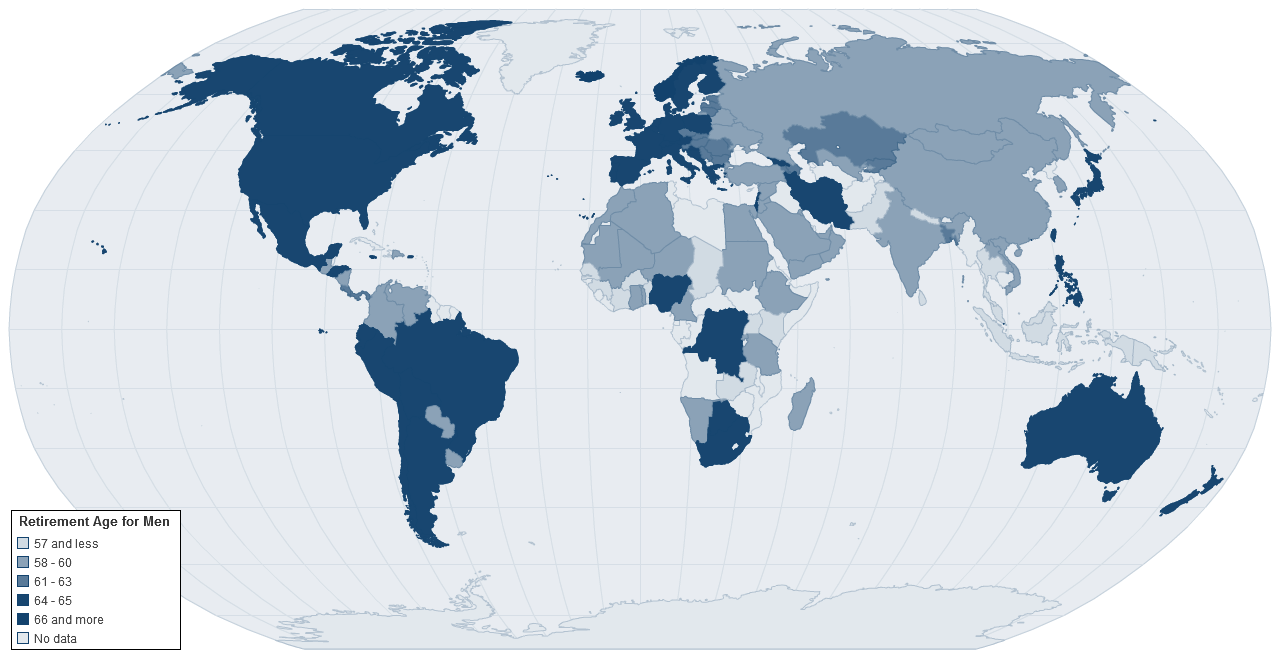
Today the retirement age varies between 57 and 65 globally depending on the country as shown in the charts below:

Click to enlarge
 

Source:  Chartsbin.com via Equities and Income in an Ageing World — Why Dividends Matter, Nikko Asset Management Asia Limited

In the chart above, lighter colored countries have lower retirement ages while darker colored countries have higher retirement ages.

From an investment point of view, it is important to plan for retirement early and invest as much as possible in younger ages.
Diversification is Key to Risk Management

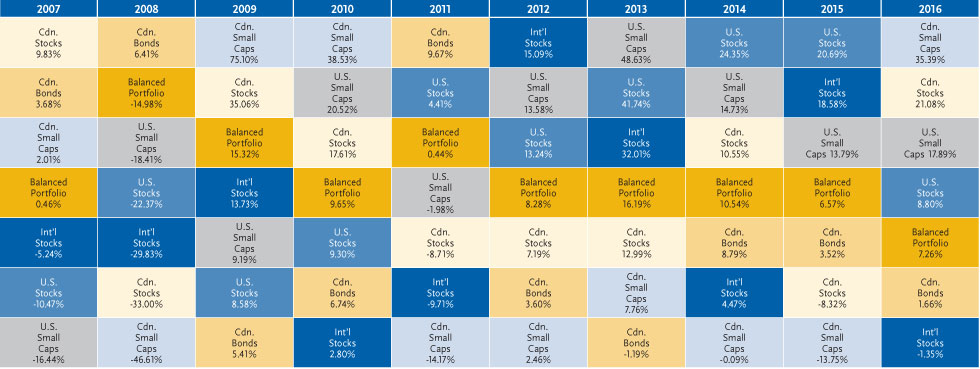
One of the simple and easy ways to reduce risks with investing in equity markets is to diversify one’s assets across various asset types, countries, regions, etc. The following chart shows the unpredictability of market returns one year after another:

Click to enlarge

Source: AGF Investment Operations, December 31, 2016. Canadian Stocks represented by S&P/TSX Composite Total Return Index, U.S. Stocks  – S&P 500 Total Return Index (C$), International Stocks  – MSCI EAFE Index (C$), Canadian Bonds – FTSE TMX Canada Universe Bond Index, U.S. Small Caps – Russell 2000 Index (C$), Canadian Small Caps – BMO Nesbitt Burns Canadian Small Cap Index. Balanced Portfolio made up of 20% Cdn. Stocks / 20% International Stocks / 15% U.S. Stocks / 40% Cdn. Bonds / 2.5% U.S. Small Caps / 2.5% Cdn. Small Caps.
The information provided is for illustrative purposes only and is not meant to provide investment advice. You cannot invest directly in an index. Calendar years returns in Canadian dollars.

Source: AGF Management Limited

Nine out of the Top 12 Most-Shorted US Stocks Are Tech Stocks

The tech sector in the US equity market has soared to astronomical levels this year. In terms of equity returns, the sector as a whole has risen more than double that of the S&P 500 so far this year. Most investors seem to have forgotten about the dot com crash and are placing their hopes on the next tech boom with things like Artificial Intelligence(AI), Cloud, Internet 2.0, e-Commerce 2.0, Self-driving cards, Internet of Things, etc. Retail investors and institutions have been piling into tech stocks in fear of missing out the boom. Long dead tech stocks like those in the semiconductor space have also shot up catch the tech craze among investors. For example, chip maker NVIDIA Corporation (NVDA) is up nearly 60% year-to-date.

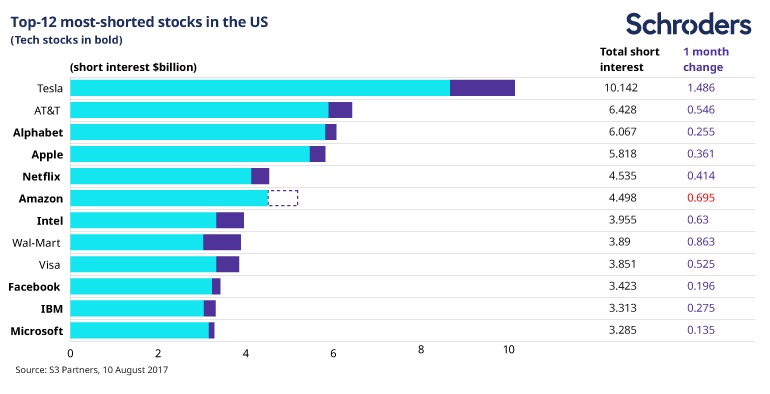
Though most investors are bullish on the sector, short-sellers are betting that these over-hyped stocks are due for a fall. According to an article at Schroders today, of the 12 most-shorted stocks in the US market, 9 stocks are from the tech sector. From the article:

Short-sellers get their teeth into FANGs

Eight out of the 12 most-shorted stocks in the US are from the tech sector, and the short interest is growing, according to latest data from S3 Partners.

If, as is frequently argued, Elon Musk’s Tesla is categorised as a tech stock rather than a car manufacturer, that figure rises to nine out of 12.

Investors “short” a stock when they expect the price to fall.

The tech sector, which includes the so-called “FANG” quartet of Facebook, Amazon, Netflix and Google (now Alphabet), has outperformed strongly in recent years. As a result, valuations have risen to levels that make some investors (including our Value team) nervous.

Year-to-date as at 29 August the S&P 500 North American Tech Sector index has risen 22.5%, compared to a return from the broad S&P 500 of 10.6%, according to Bloomberg. Over three years the respective numbers are 64% versus 36%.

Past performance is not a guide to future performance and may not be repeated.


SourceChart attack: Seven market snapshots from August, Schroders

The key takeaway for investors is that caution is warranted with investing in tech stocks at the current levels.

Disclosure: No Positions

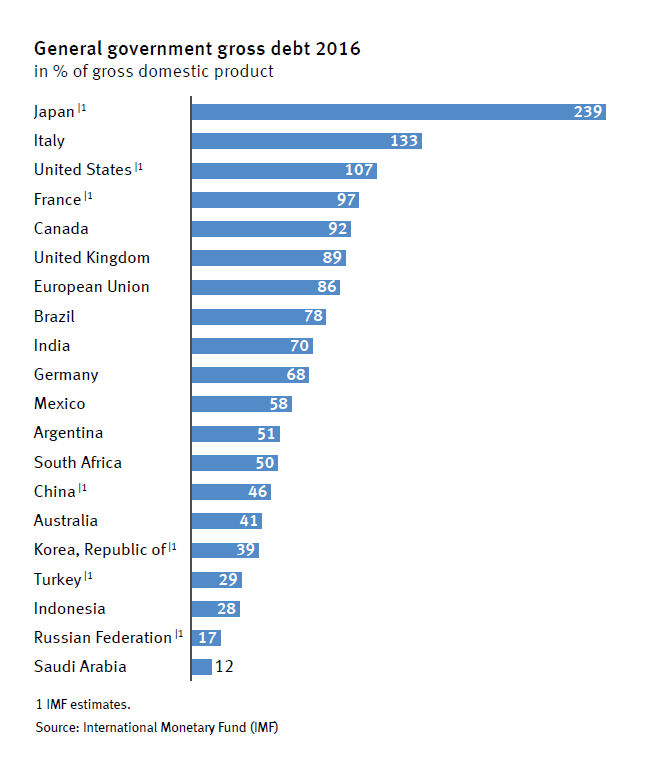
General Government Gross Debt as a Percentage of GDP by Country 2016

The majority of the G-20 countries recorded a deficit in 2016. Only South Korea and Germany had a budget surplus last year. In all the other countries government expenditures exceeded revenues.

The gross debt level also remains high in G-20 countries. The chart below shows that Japan had the highest debt levels that was over double of its GDP. The next high debt countries were Italy and USA whose debt was more than their respective GDPs.

Click to enlarge


Source: G20 in Figures – Summit of the G20 states in Hamburg 2017